Trendline Trading Explained: A Beginner's Guide
Learn trendline trading step by step. Identify key support zones and trade breakouts with confidence. Read the full guide.
By Trader Faculty Team
Direct Answer
Trendline trading is a technical analysis method that uses dynamic diagonal lines drawn across price peaks or valleys to identify market direction and dynamic support or resistance zones. Traders use these boundaries to locate entry signals, such as trend continuation bounces or structural breakout reversals, while establishing objective risk parameters.
Trendline trading is a technical analysis method that uses dynamic diagonal lines drawn across price peaks or valleys to identify market direction and highlight potential support or resistance zones on a chart.
Many beginners try drawing lines through random chart points, only to watch price break through immediately and trigger unnecessary losses. Learning how to draw trendlines correctly gives you an objective visual roadmap of market structure. This guide explains key drawing rules, core setups, risk control, and practical ways to filter false breakouts.
Quick Takeaways
- A minimum of two price points creates a tentative trendline, while a third touch confirms its validity.
- Uptrend lines act as dynamic support under rising swing lows, while downtrend lines act as dynamic resistance over falling swing highs.
- The two main entry setups are trading a trendline bounce for continuation or a trendline breakout for structural reversals.
- Waiting for candle closes and volume validation protects traders against volatile false breakouts.
What Is Trendline Trading?
Trendline trading relies on drawing diagonal lines across price charts to track the direction of market momentum. Unlike static horizontal lines that mark a single price level, a trendline moves diagonally over time to show how price changes relative to market rhythm.
Price action rarely moves in a straight line. Markets advance and fall in waves, creating peak price points called swing highs and valley price points called swing lows.
Connecting these structural points creates two basic types of trendlines:
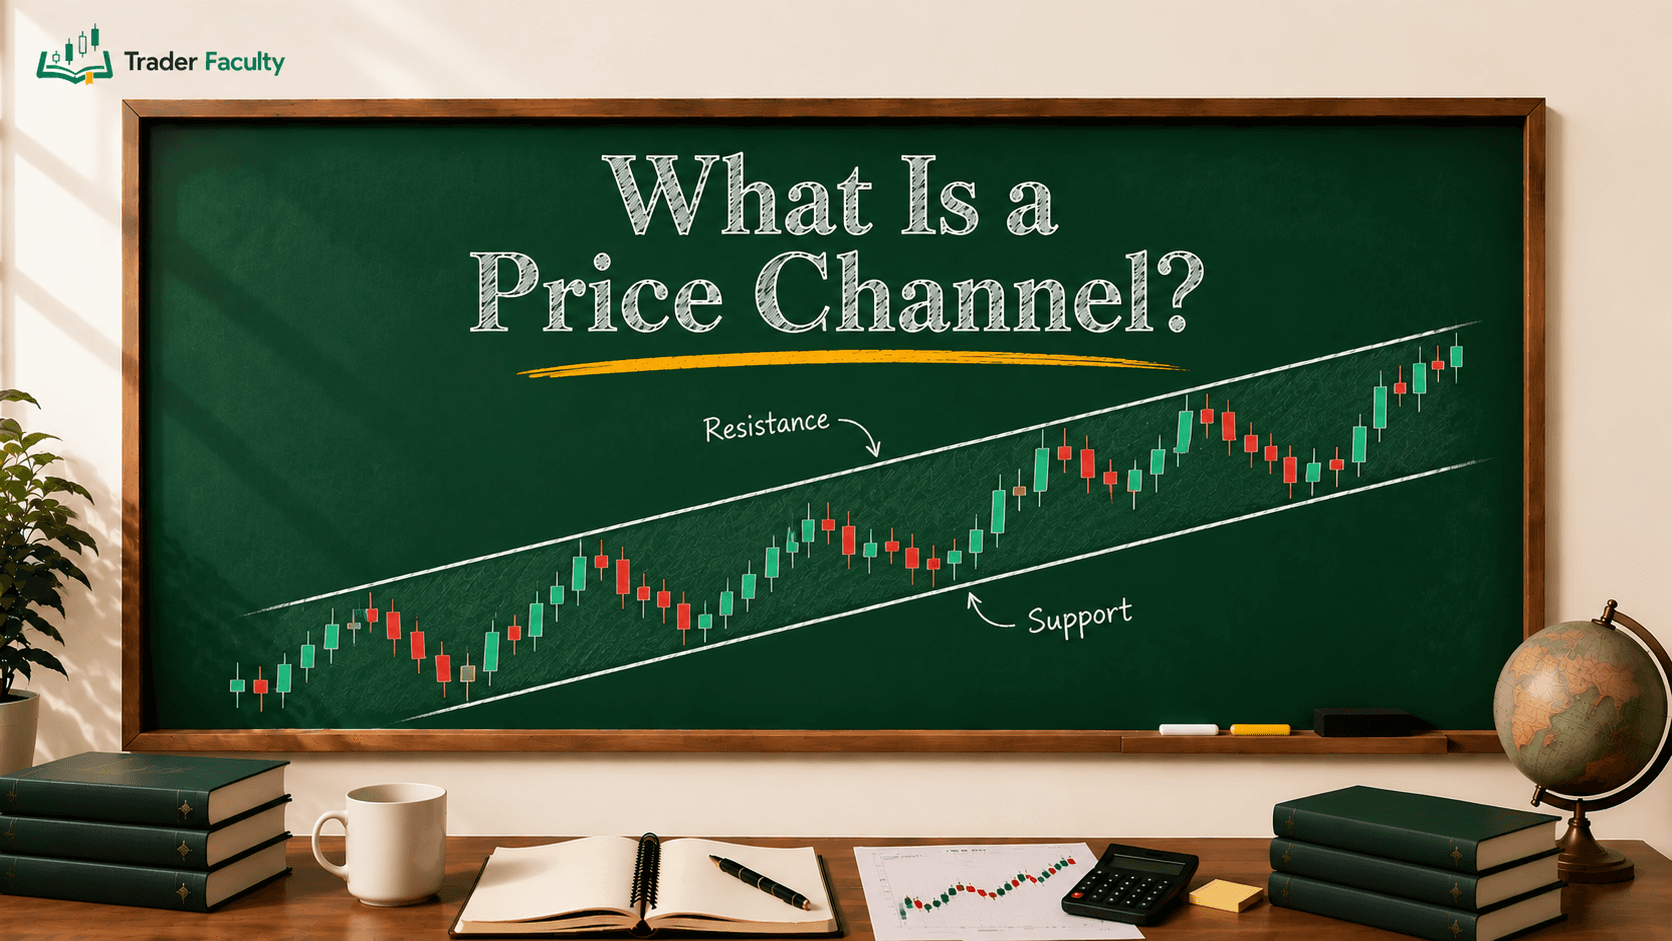
- Uptrend Line: Drawn below price action by connecting a series of higher swing lows. This diagonal line acts as dynamic support, showing where buyers have repeatedly entered the market to push prices higher.
- Downtrend Line: Drawn above price action by connecting a series of lower swing highs. This diagonal line acts as dynamic resistance, showing where sellers have consistently entered the market to push prices lower.
By mapping these dynamic boundaries, traders can observe market structure without relying on complex indicators. Trendlines help you determine whether the current trend is strong, weakening, or transitioning into a sideways market.
How to Draw Valid Trendlines
Drawing trendlines is a simple skill, but doing it accurately requires consistent rules. If you draw lines haphazardly across a chart, you risk creating optical illusions that lead to poor trading decisions.
The 2-Point vs. 3-Point Validation Rule
To draw a trendline, you need at least two swing points. However, two points only create a tentative line:
- Two Touchpoints (Tentative Line): Connecting two swing lows or two swing highs allows you to project a tentative trendline into the future. It shows potential direction, but the market has not tested the level yet.
- Three Touchpoints (Confirmed Line): When price returns to the projected line a third time and reacts away from it, the trendline is confirmed. A confirmed line indicates that market participants are actively respecting that dynamic boundary.
Candle Wicks vs. Candle Bodies
A common question among visual analysts is whether to connect extreme candle wicks or candle bodies.
The most consistent approach is to connect candle wicks, as wicks mark the absolute high or low price achieved during a given period. However, if an extreme wick is an isolated spike caused by brief volatility, you can draw the line through the outer edge of the candle body cluster instead. The key rule is consistency: do not mix wicks and bodies on the same line to force a clean fit.
Trendline Angles and Sustainability
The angle of a trendline shows the speed of the trend. Lines angled at roughly 30 to 45 degrees represent sustainable market trends where buying and selling pressure remain balanced over time.
When a trendline becomes extremely steep (greater than 45 degrees), it reflects rapid momentum that is difficult to sustain. Steep lines often break quickly during minor pullbacks without signifying a complete trend reversal. When this occurs, traders adjust their trendlines outward to match the broader market pace.
Core Trendline Trading Strategies
Once you establish confirmed trendlines on your chart, you can apply an objective trendline trading strategy to locate entries and manage risk. Traders generally focus on two primary entry styles: bounces and breakouts.
Strategy 1: The Trendline Bounce (Trend Continuation)
The trendline bounce aims to join an ongoing trend at a favorable price point. In an uptrend, traders look for price to pull back toward dynamic support.
- Entry Signal: Rather than placing a limit order right on the line, wait for price to touch the dynamic support zone and form a bullish confirmation candle, such as a hammer (a candle with a small body and long lower wick) or a bullish engulfing pattern (a larger bullish candle that fully covers the prior bearish candle).
- Stop-Loss Placement: Place your stop-loss order slightly below the recent swing low underlying the trendline.
- Target Zone: Set your profit target near the previous swing high or at a key horizontal resistance level ahead.
Strategy 2: The Trendline Breakout (Trend Reversal)
A trendline breakout occurs when price moves through a dynamic boundary, signaling that current momentum is fading.
- Entry Signal: Look for a strong candle close beyond the trendline. For added safety, many traders wait for a retest, where price returns to touch the broken trendline from the opposite side before continuing in the new direction.
- Stop-Loss Placement: For a breakout above dynamic resistance, place your stop-loss below the breakout candle or the retest swing low.
- Target Zone: Target structural support or resistance levels derived from earlier price legs.
Adding Confluence with Chart Patterns

Combining trendlines with structural chart patterns increases trade clarity. For example, if price reaches a downtrend line and simultaneously forms a double bottom chart pattern (two swing lows at a similar price level, signaling a potential reversal), the combination of dynamic resistance breaking and a structural reversal pattern provides stronger confluence than a single signal alone.
According to educational materials published by the CFA Institute, technical tools like trendlines are most effective when used to evaluate supply and demand balances rather than predicting exact future price movements.
| Strategy | Entry Trigger | Stop-Loss Location | Primary Goal |
|---|---|---|---|
| Trendline Bounce | Reaction candle at 3rd touch | Below/above recent swing point | Trade trend continuation |
| Trendline Breakout | Candle close beyond line or retest | Opposite side of breakout structure | Trade trend reversal |
Managing Risk and Avoiding False Breakouts
False breakouts occur when price crosses a trendline during a session but reverses back inside the line before the candle closes. Trapping aggressive traders who enter early is common during high market volatility.
To reduce exposure to false breakouts, apply these confirmation filters:
- Candle Close Verification: Require the candle to close completely outside the trendline boundary on your chosen timeframe before taking a position.
- Volume Validation: True breakouts often show above-average volume. If price crosses a trendline on light trading volume, the move may lack institutional backing.
- Position Sizing Rules: Keep risk consistent on every trade by risking a fixed percentage of your total account balance (such as 1% to 2%).
Common Trendline Trading Mistakes
Even experienced traders make mistakes when using dynamic trendlines. Avoiding these three common traps will keep your visual analysis clean and reliable:
- Force-Fitting Lines: Redrawing trendlines at strange angles just to align with your current directional bias. If a line does not connect swing points cleanly, accept that the market is not trending clearly.
- Trading Ultra-Steep Lines: Expecting rapid vertical moves to hold as solid dynamic support. Steep lines break frequently during minor pullbacks.
- Treating Lines as Exact Single Prices: Expecting price to turn on the exact cent or pip where your line sits. Always view trendlines as dynamic zones rather than rigid barriers.
Conclusion
Integrating trendlines into your trading toolkit helps you read raw price action, identify market trends, and plan entries with structured risk control. By waiting for three-point confirmation, using candle closes to verify breakouts, and combining dynamic lines with horizontal levels, you can make clear decisions based on market structure.
To build a complete market perspective, explore how dynamic trendlines fit into the broader foundation of technical analysis alongside horizontal levels and volume analysis. Trading financial markets always carries the risk of capital loss, so treat every pattern as a framework for managing probability rather than a guarantee of market behavior.
Frequently Asked Questions
How do you draw accurate trendlines on a price chart?
To draw accurate trendlines, connect at least two major swing points—either swing lows for an uptrend or swing highs for a downtrend. A tentative line requires two touchpoints, while a third touch confirms that the market is actively respecting the dynamic boundary. Always maintain consistency by connecting either wicks to wicks or candle bodies to bodies across your charts.
Do you draw trendlines from candle wicks or candle bodies?
Connecting extreme candle wicks is standard practice because wicks mark the absolute highest or lowest prices reached during a session. However, if an extreme wick represents an isolated news spike, connecting outer candle bodies is acceptable. The critical rule is visual consistency: avoid mixing wicks and bodies on the same line.
How many touches confirm a valid trendline?
Two touchpoints create a tentative trendline, while three touchpoints confirm its validity. When price returns to test the projected line a third time and reacts away from it, market participants confirm the level as dynamic support or resistance.
What is the difference between a trendline bounce and a breakout?
A trendline bounce occurs when price touches dynamic support or resistance and reacts back in the direction of the existing trend, signaling trend continuation. A trendline breakout happens when price closes beyond the dynamic line, indicating that current momentum is fading and a potential market reversal is under way.
How can traders avoid false trendline breakouts?
Traders avoid false breakouts by waiting for the active candle to close completely beyond the trendline rather than entering during intra-bar spikes. Additionally, checking for above-average trading volume during the break and waiting for a retest of the broken boundary provides extra entry confirmation.
The Trader Faculty Team writes and reviews every guide together — pairing hands-on market experience with a curriculum-first approach to trading education. One good syllabus, taught in the order that makes you better.