Turtle Trading Strategy Explained: Rules and Mechanics
Learn how the turtle trading strategy works, from breakout rules to volatility sizing. Read the full guide.
By Trader Faculty Team
Direct Answer
The turtle trading strategy is a mechanical trend-following system developed in 1983 by Richard Dennis and William Eckhardt. It uses Donchian Channel breakouts to enter sustained market trends and sizes every position according to market volatility so that each trade risks exactly 1% of total account capital.
The turtle trading strategy is a complete, rules-based trend-following system designed to buy breakouts at new highs and sell short at new lows across liquid futures markets.
Many traders struggle because emotions take control during volatile market swings, causing them to cut winning trades early or hold losing trades too long. In 1983, legendary commodity trader Richard Dennis set out to prove that anyone could succeed by following strict mechanical rules rather than intuition. This guide breaks down how the system works, its entry and exit signals, how to size positions by market volatility, and the discipline needed to trade it.
Quick Takeaways
- The strategy uses Donchian Channels to enter trends on 20-day or 55-day price breakouts.
- Position sizing adjusts to market volatility using Average True Range so each trade unit risks exactly 1% of account equity.
- Winning trades are pyramided up to four units while losing trades are cut at a strict two-volatility stop loss.
- As documented in Michael Covel's The Complete TurtleTrader, traders had to accept a low win rate between 30% and 40% and deep drawdowns to capture rare, large market trends.
What Is the Turtle Trading Strategy?
This is a classic systematic trend-following model that removes emotional guesswork by automating entries, exits, and position sizing.
To understand what is turtle trading strategy, you have to look at the famous bet behind it. In 1983, Richard Dennis and his trading partner William Eckhardt debated whether trading skill was an inborn gift or a set of rules that could be taught to anyone. Dennis had visited a turtle-breeding farm in Singapore and claimed he could grow traders as easily as the farm raised turtles.
To test his theory, they placed an advertisement in the Wall Street Journal seeking applicants. They picked a small group of beginners—including an actor, a game designer, and an accountant—trained them for two weeks, and watched them earn large profits.
At its core, the turtle trading strategy meaning comes down to objective trend following. You do not try to predict tops or bottoms. Instead, you accept that prices move in sustained trends and you let the market tell you what to do. The strategy requires traders to buy strength, sell weakness, cut losses fast when the market turns, and let winning positions run until the trend bends.
Core Mechanics: System 1 and System 2 Breakouts

The turtle trading strategy explained in practice relies on two distinct breakout systems built around Donchian Channels, which track rolling highs and lows over specific time windows.
The Turtles traded two distinct setups across a broad basket of liquid commodity, currency, and bond futures:
System 1 (Short-Term System)
- Entry: Buy when the price breaks one tick above the highest high of the previous 20 trading days. Sell short when the price breaks one tick below the lowest low of the previous 20 trading days.
- The Filter Rule: Skip the 20-day breakout if the previous 20-day breakout signal resulted in a winning trade. This filter was designed to keep traders out of false breakouts in choppy, sideways markets.
- The 55-Day Fallback: If you skipped a 20-day breakout because the prior trade was a winner, the setup is not lost. The system still calls for an entry once the market continues surging to a 55-day high or low. This ensured the Turtles never missed a massive trend.
- Exit: Exit long positions when the price hits a 10-day low, and exit short positions when the price hits a 10-day high.
System 2 (Long-Term System)
- Entry: Buy when the price breaks one tick above the 55-day high. Sell short when the price breaks one tick below the 55-day low.
- No Filter Rule: Every 55-day breakout signal is taken, regardless of whether the prior trade won or lost.
- Exit: Exit long positions when the price hits a 20-day low, and exit short positions when the price hits a 20-day high.
Risk Management and Volatility-Based Position Sizing
The real secret of the Turtle system is not its breakout entries, but its volatility-adjusted position sizing, which ensures every trade risks the exact same percentage of capital.
Dennis and Eckhardt used a volatility measure called N, which is the 20-day Average True Range (ATR). True Range measures the distance price travels in a single day. It is calculated as the largest of three numbers. These are today’s high minus today’s low, the distance from yesterday’s close to today’s high, and the distance from yesterday’s close to today’s low.
Because different markets have different price ranges, N standardizes risk across all instruments. A single "Unit" of trading size is calculated using two simple formulas:
Dollar Volatility = N × Dollars per Point
Unit Size = (Account Equity × 0.01) / Dollar Volatility
Here is a step-by-step example:
Suppose your account equity is $100,000. Exactly 1% of your account equals $1,000 of risk.
You want to trade crude oil futures, where one contract represents 1,000 barrels ($1,000 per dollar of price movement).
If the 20-day N for crude oil is $2.00, the Dollar Volatility is $2.00 × 1,000 = $2,000 per contract.
Your Unit Size is $1,000 / $2,000 = 0.5 contracts. Because futures do not allow fractional contracts, you would need $200,000 in equity to trade one full contract at a 1% risk level.
The U.S. Commodity Futures Trading Commission explains that in an individual futures account, the leveraged nature of transactions can result in significant losses, and losses may exceed the initial margin deposit. This makes strict position sizing essential.
To prevent sudden market shocks from wiping out the account, Dennis also set strict portfolio limits. He capped a single market at 4 units, closely correlated markets such as gold and silver at 6 units, and loosely correlated markets at 10 units.
Pyramiding and Stop-Loss Execution
The Turtles maximized their profits by pyramiding—adding more units as the trend proved itself—while keeping total trade risk strictly limited.
Once an initial unit was open, the Turtles added more units at fixed intervals:
- Add 1 Unit every time the price moved in their favor by 1/2 N (half of the N value).
- The maximum position was capped at 4 units total.
Stop losses were just as mechanical. Every trade carried a hard stop loss set at 2N below the most recent entry price. When a new unit was added, the stop loss for all previous units moved up by 1/2 N. This trailing stop locked in gains on earlier units and kept the total risk across the entire 4-unit position strictly capped.
Turtle Breakouts vs. Pullback Trading
While the Turtle strategy buys explosive momentum when price hits a multi-week high, alternative trend systems wait for price to pause before entering.
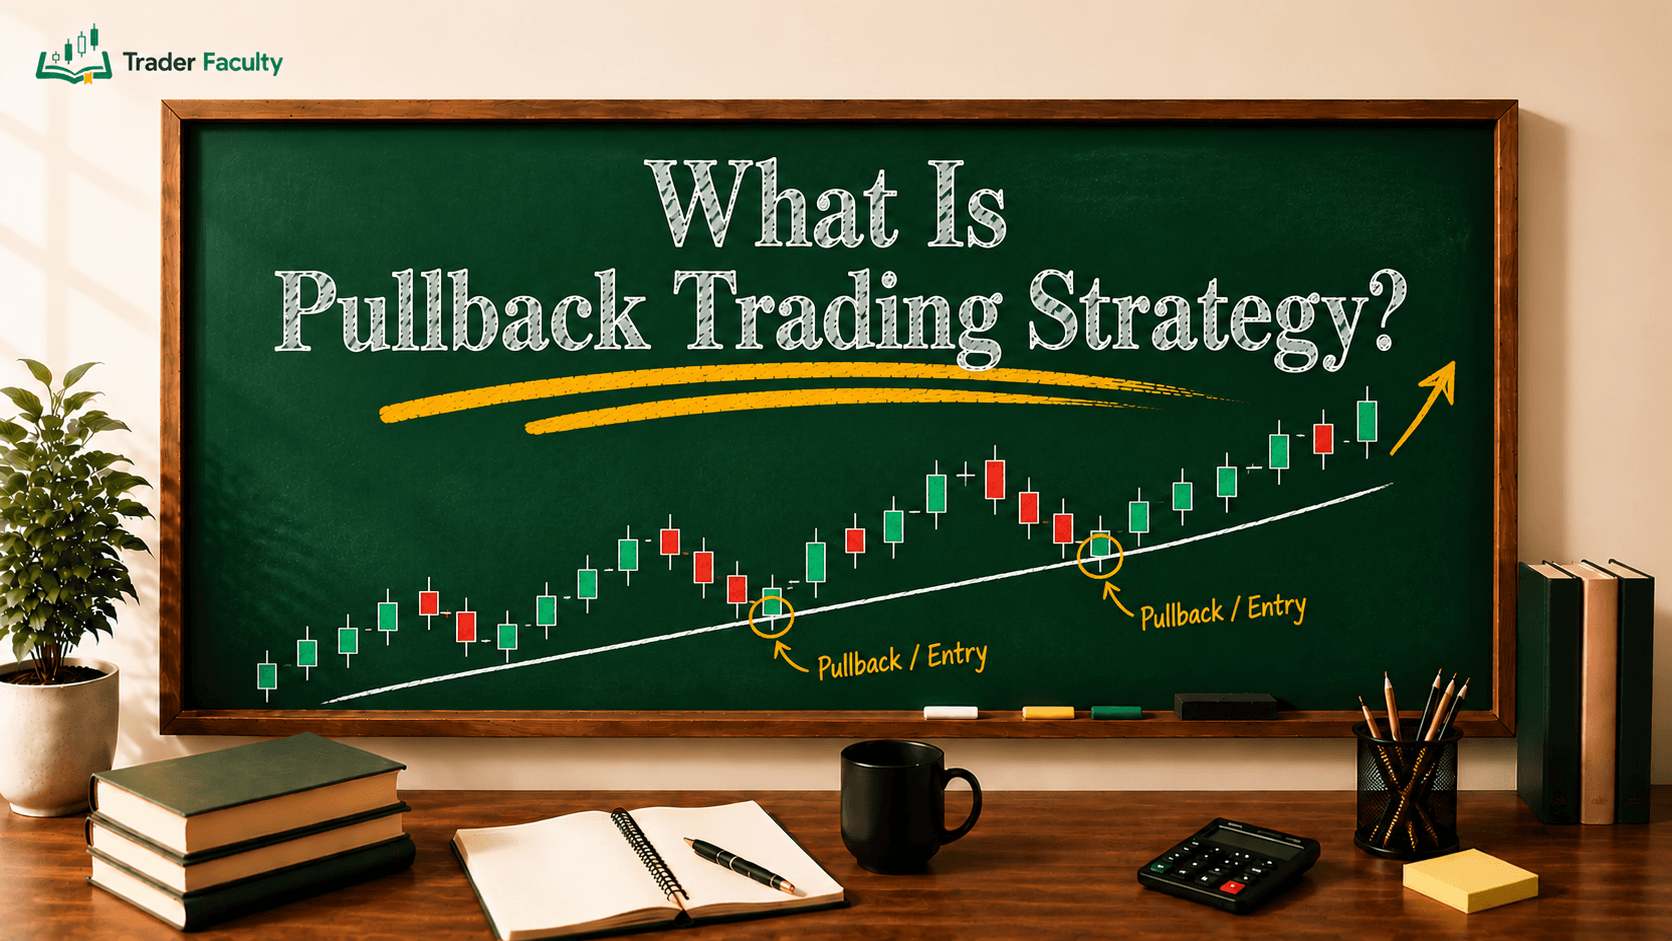
Entering on a breakout helps you catch most major trends, but it forces you to buy at the highest price on the chart, which leads to many false signals. In contrast, using a pullback trading strategy means waiting for price to retrace toward support or a moving average during an uptrend. Pullback entries offer a tighter entry price and a higher win rate, but you risk missing runaway moves that surge forward without ever dipping back.
| Feature | Turtle Breakout System | Pullback Trading |
|---|---|---|
| Entry Trigger | 20-day or 55-day new high or low | Retracement to support or moving average |
| Win Rate | Low (typically 30% to 40%) | Moderate (typically 45% to 55%) |
| Risk-to-Reward | Very high (captures rare mega-trends) | Moderate (targets recent swing highs) |
| False Signal Risk | High (many whipsaws in sideways ranges) | Moderate (the trend may fail and reverse) |
| Main Challenge | Surviving long losing streaks | Missing runaway trends that do not pull back |
Common Pitfalls and Why Trend Following Is Difficult
The greatest hurdle for anyone using the Turtle strategy is psychological endurance, as traders must survive long dry spells and steep equity drops without giving up.
Trend-following systems produce low win rates, typically between 30% and 40%. In ranging markets, price frequently breaks past the 20-day high only to reverse immediately, generating small loss after small loss. These repeated small cuts are known as whipsaws.
During these choppy periods, the Turtles suffered deep drawdowns that reached between 30% and 40% of their equity. Watching account balances slide for weeks or months tests human discipline to its limit. Many modern traders abandon the system during a losing streak, right before a major trend begins that would have recovered their losses.
Conclusion
The true legacy of the turtle trading strategy is that market success comes from systematic execution, strict risk control, and emotional detachment rather than market forecasting.
Richard Dennis proved that discipline beats guesswork. While the exact parameters from 1983 face greater competition in today's electronic markets, the core principles—cutting losses at 2N, sizing trades by volatility, and letting profits run—remain foundational. Comparing trend following with other systematic trading strategies helps you choose a framework that matches your capital and personality.
Trading always carries the risk of losing capital, and mechanical systems require careful backtesting and risk budgeting before committing live funds.
Frequently Asked Questions
What markets did the original Turtle Traders trade?
The original Turtles traded a diversified basket of highly liquid commodity futures contracts. This included agricultural commodities like coffee, sugar, and corn, energy markets like crude oil and heating oil, precious metals like gold and silver, foreign currencies, and government bond futures. Dennis required markets to have deep liquidity so large position units could enter and exit without excessive price slippage.
Does the turtle trading strategy still work in modern markets?
Many traders observe that the classic 20-day breakout rules may struggle more today, as electronic trading and algorithmic funds appear to create more frequent false breakouts in sideways markets. However, the underlying core principles—trading in the direction of long-term momentum, sizing positions by volatility, cutting losing positions quickly, and letting winning trades run—remain effective when applied across wide, multi-asset portfolios with updated breakout filters.
What is the typical win rate of the turtle trading system?
The turtle trading system typically produces a win rate between 30% and 40%, because breakout systems take repeated small losses during range-bound regimes and most individual trades are unprofitable. The strategy generates long-term profits through an asymmetric payoff profile, where a handful of outsized, multi-month winning trends more than make up for the string of small whipsaw losses.
What indicators are required to trade the Turtle strategy?
The strategy relies primarily on Donchian Channels and Average True Range (ATR). Donchian Channels plot the highest high and lowest low over 20 or 55 days to generate mechanical breakout entry and exit signals. Average True Range—referred to as N by Richard Dennis—measures daily price volatility to calculate exact position sizing and determine the 2N stop-loss level.
Can you apply the turtle trading strategy to stocks or crypto?
Yes, traders can adapt the Turtle rules to stocks, exchange-traded funds, and cryptocurrencies, but they must account for asset-specific risks. Individual stocks experience corporate earnings gaps and market closures that can jump past a 2N stop loss. Crypto markets face extreme volatility and lack centralized settlement, so using wider breakout channels and lower risk per unit helps handle these conditions.
Keep learning
Build Your Trading System
Turn scattered tactics into one system you can actually follow.
8 lessons quiz
Build your systemThe Trader Faculty Team writes and reviews every guide together — pairing hands-on market experience with a curriculum-first approach to trading education. One good syllabus, taught in the order that makes you better.