How to Read Forex Charts: A Beginner's Guide
Learn how to read forex charts, understand candlestick price points, and spot market trends. Read the full guide.
By Trader Faculty Team
Direct Answer
A forex chart is a graphical representation of exchange rate movements between two currencies over specified time intervals. The vertical axis reflects the exchange rate in pips while the horizontal axis tracks time, allowing traders to observe price action and evaluate supply and demand dynamics.
A forex chart is a visual display that plots the exchange rate between two currencies over a chosen time period. It shows how the value of one currency changes relative to another, giving traders an objective view of historical price movements.
Opening a trading screen for the first time can feel overwhelming. Flashing candles, shifting tick lines, and rapid numbers often look more like static noise than useful market data. Learning how to interpret these visual patterns allows you to spot trends, locate support and resistance levels, and manage risk systematically. This guide breaks down the core chart types, price mechanics, and common pitfalls you need to understand.
Quick Takeaways
- The vertical Y-axis tracks currency exchange rates in pips, while the horizontal X-axis marks chronological time.
- Japanese candlestick charts reveal four key price levels per session: open, high, low, and close (OHLC).
- Retail trading platforms display the bid price by default, meaning buy orders fill higher at the ask price.
- Multi-timeframe analysis connects broad market trends on daily charts with precise entries on lower timeframes.
What Is a Forex Chart and How Does It Work?
A forex chart illustrates the relative value of a currency pair by plotting exchange rate changes on the vertical Y-axis against chronological time on the horizontal X-axis. The horizontal axis moves from left to right, showing time intervals such as minutes, hours, or days. The vertical axis displays the exchange rate, showing how many units of the second currency are needed to purchase one unit of the first currency.
Currencies always trade in pairs, such as EUR/USD or GBP/JPY. The first currency listed is the base currency, and the second is the quote currency. For example, if EUR/USD is priced at 1.0850, one euro costs 1.0850 US dollars.
When the chart moves upward, the base currency is gaining value against the quote currency. When the chart moves downward, the base currency is weakening.
Price movements on the vertical axis are measured in pips (percentage in point) — that is, the smallest standard price increment used in currency trading quotes. For most major pairs, one pip equals 0.0001 (the fourth decimal place). For pairs with the Japanese yen, one pip equals 0.01 (the second decimal place). Learning how to read forex charts for beginners starts with understanding this two-currency relationship, as every movement on screen reflects changing supply and demand between two national economies.
Three Main Chart Types: Line, Bar, and Candlestick
Traders use three standard chart formats to track currency prices: line charts, bar charts, and Japanese candlestick charts. Each format organizes market data differently, offering distinct trade-offs between simplicity and detail.
Line charts provide the simplest view of currency action. A line chart plots only the closing price of each period and connects those points with a continuous line. Because it ignores intraday highs and lows, a line chart filters out market noise.
It helps you identify broad trends across weeks or months. However, the trade-off is that you cannot see the full price range or intraday volatility that occurred during each session.
Bar charts, also known as OHLC charts, provide complete session detail. Each bar consists of a vertical line with two small horizontal ticks. The top of the line marks the highest price, and the bottom marks the lowest.
A horizontal tick pointing left shows the opening price, and a tick pointing right marks the closing price. Bar charts show the full range between buyers and sellers, but they can be visually straining to scan quickly across multiple markets.
Japanese candlestick charts are the industry standard for technical currency analysis. Candlestick charts present the same four price points as bar charts, but use a wide, colored block called the real body between the open and close. If price closes higher than it opened, the candle body is typically green or white.
If price closes lower, the body is red or black. Thin lines extending above and below the body, known as wicks or shadows, show the session extremes. This visual contrast makes buying and selling momentum easy to spot at a glance.
| Chart Type | Best Used For | Key Trade-off |
|---|---|---|
| Line Chart | Identifying macro market direction | Hides session highs and lows |
| Bar (OHLC) Chart | Analyzing raw price volatility | Harder to read quickly on busy screens |
| Candlestick Chart | Spotting momentum and reversal patterns | Can feel visually crowded for new traders |
Candlestick Anatomy: How to Read the 4 Key Price Points

Every Japanese candlestick provides a visual summary of four specific price points during a trading session: Open, High, Low, and Close (OHLC). Understanding how these four points interact tells you which side of the market controlled price during that specific window of time.
On a bullish candle, price closes higher than it opened. The bottom edge of the rectangular real body marks the opening price, while the top edge marks the closing price.
On a bearish candle, price closes lower than it opened. The top edge of the real body represents the opening price, and the bottom edge represents the closing price. The height of the real body reflects the net distance price traveled from open to close.
The thin vertical lines extending from the body are called wicks or shadows. The upper wick stretches to the highest price reached during the session, while the lower wick drops to the lowest price. Wicks reveal important clues about price rejection:
- A long upper wick shows that buyers pushed price upward, but sellers took control before the close and forced price back down.
- A long lower wick indicates that sellers drove price down, but buyers stepped in, absorbing selling pressure and lifting price back up.
- A small real body with long wicks on both sides indicates balance and indecision between buyers and sellers.
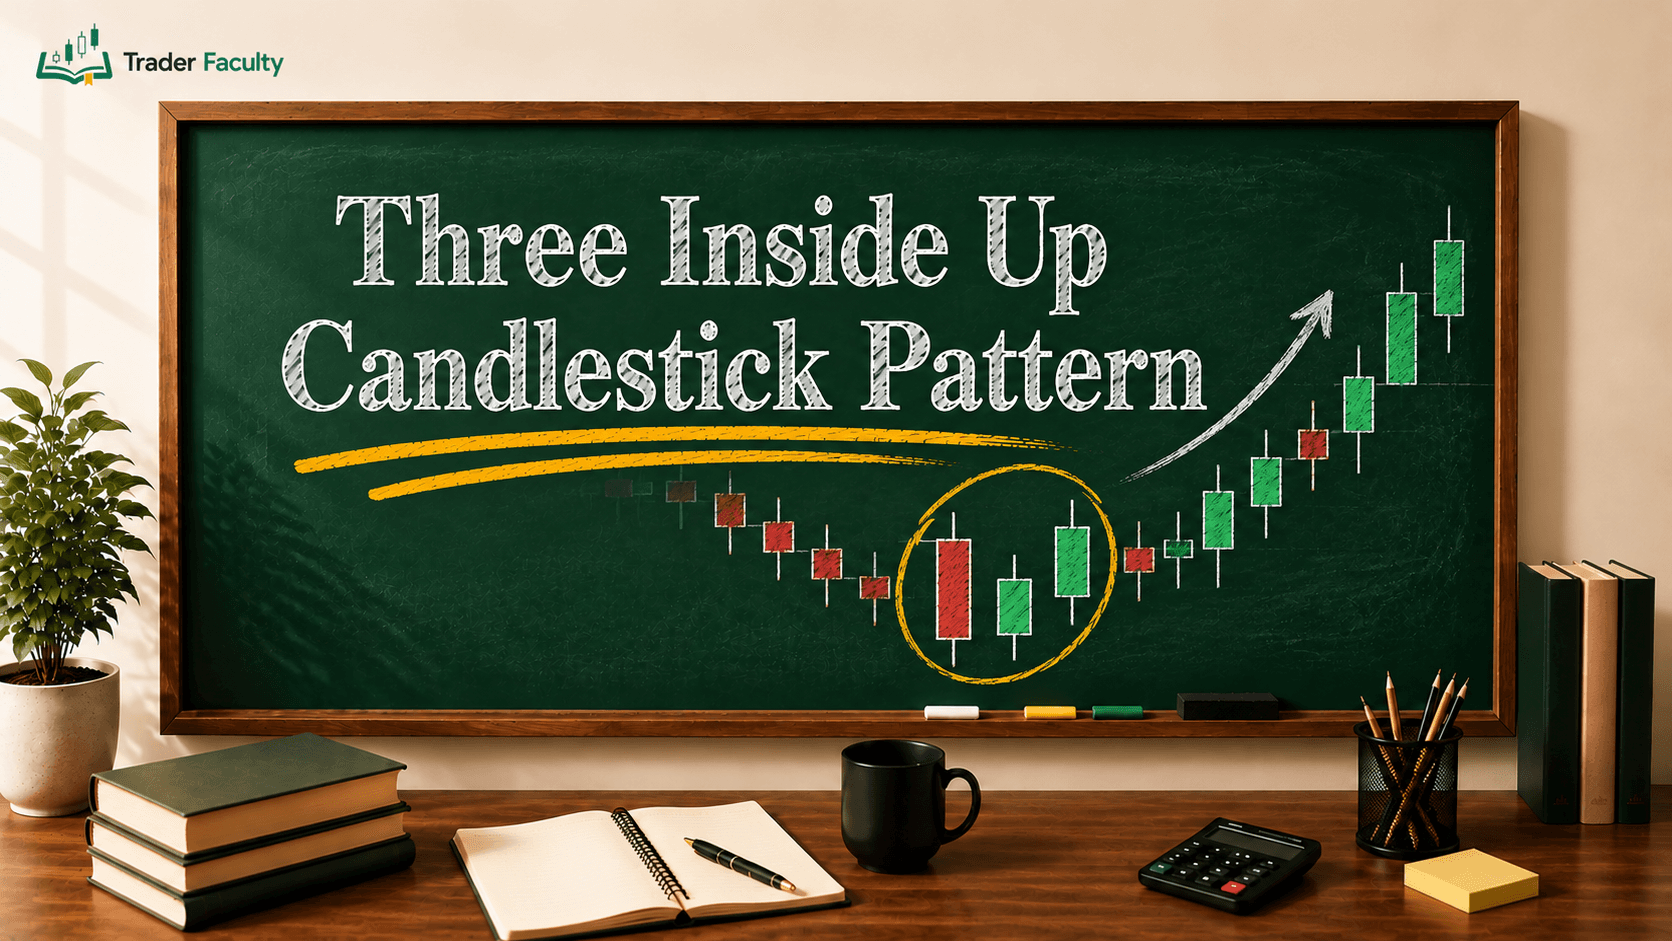
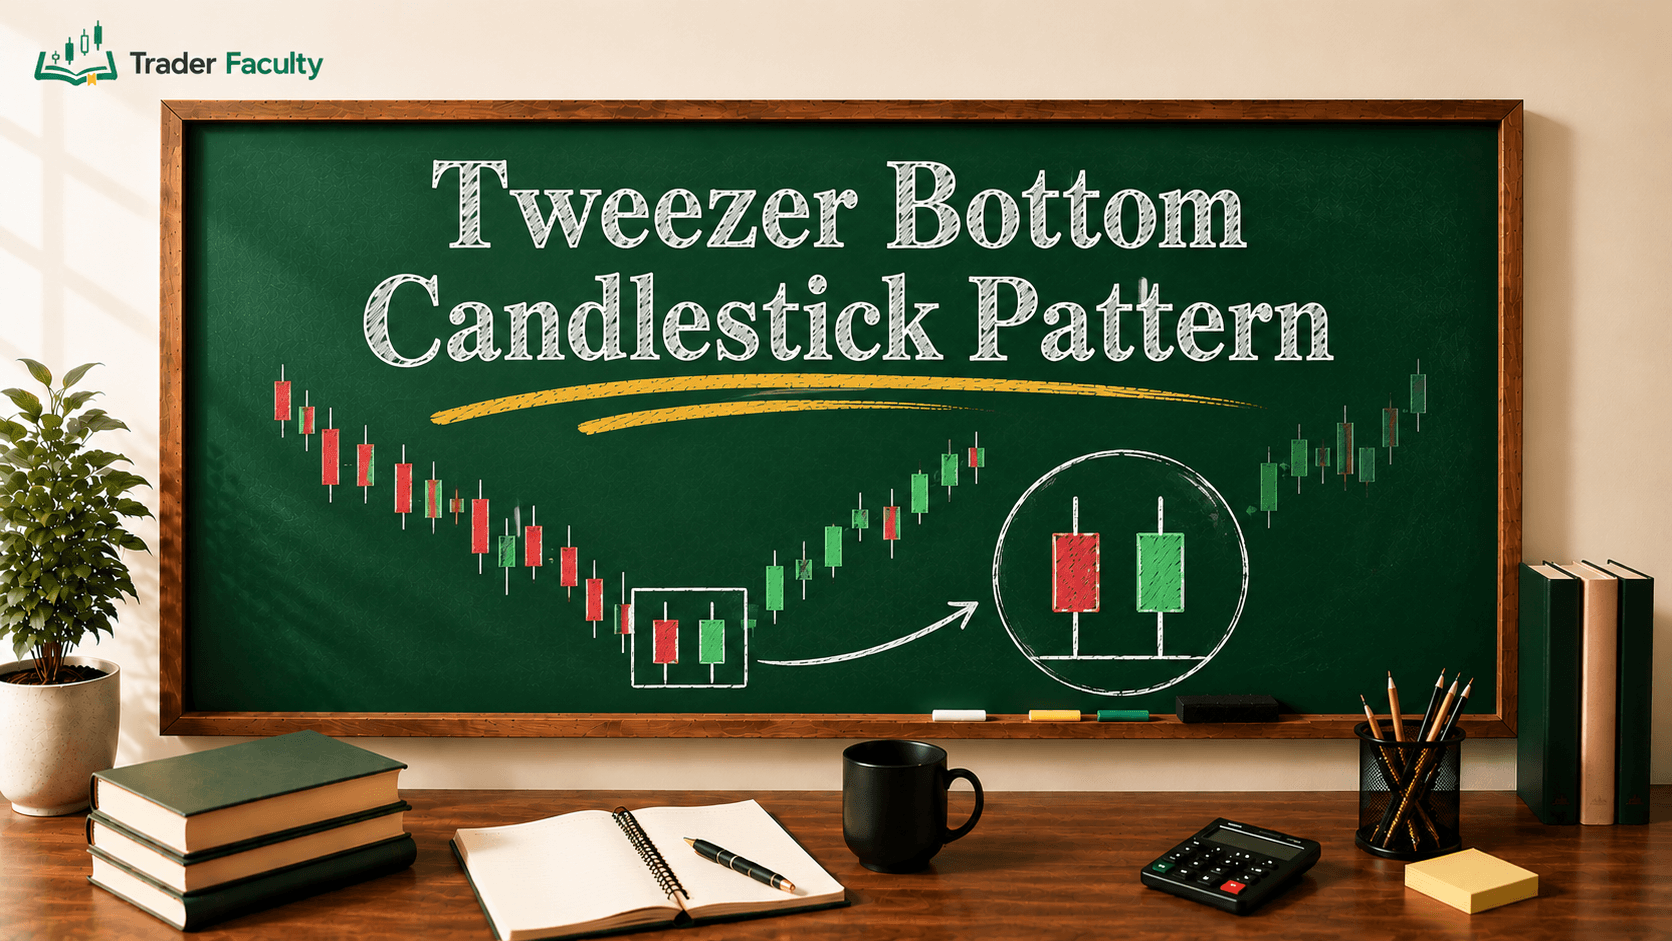
When multiple candlesticks form recognizable sequences over several sessions, they create forex patterns that traders use to evaluate whether an existing trend will continue or reverse. Understanding this four-point framework is the foundation of having read forex charts explained simply, because every candle reflects the balance of power between buyers and sellers.
Choosing the Right Timeframe: From Minutes to Days
A chart timeframe determines the exact duration of market activity shown by each individual candle or bar. Selecting the right timeframe depends on your trading style and your holding period.
On a 5-minute (M5) chart, each candle represents five minutes of price action. On a 1-hour (H1) chart, each candle covers sixty minutes. On a daily (D1) chart, every candle records the complete 24-hour trading day.
Higher timeframes, such as the 4-hour, daily, and weekly charts, filter out short-term market noise. They display clearer trends and show major horizontal support and resistance zones where commercial banks and institutional funds operate.
Lower timeframes, such as the 1-minute, 5-minute, or 15-minute charts, show fast price swings. While day traders use them to time trade entries, lower timeframes are filled with random market noise and false breakouts. If you only look at low-timeframe charts, you risk losing sight of the broader market direction.
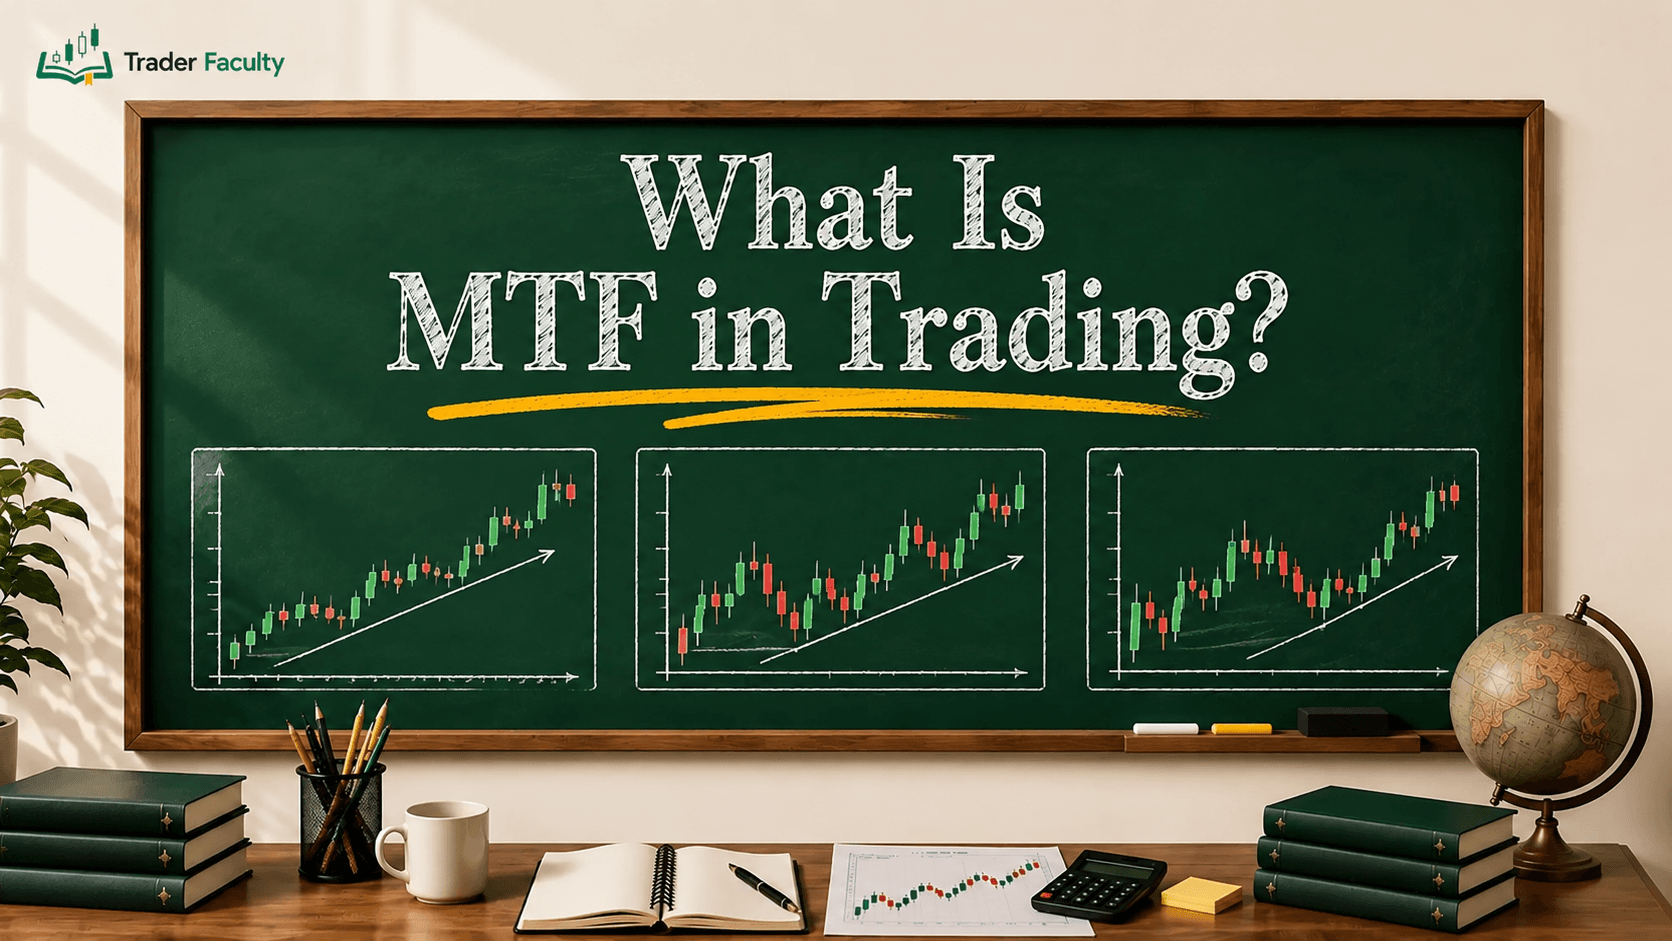
To solve this problem, traders rely on multi-timeframe analysis. You start by analyzing a higher timeframe, like the daily chart, to identify the dominant trend and major support and resistance levels. Then, you step down to an intermediate timeframe, like the 1-hour chart, to assess market structure.
Finally, you move to a lower timeframe, like the 15-minute chart, to look for entry triggers that align with the higher-timeframe trend. Using this structured approach gives you a practical read forex charts guide that can help you avoid trading directly into major support or resistance zones.
The Hidden Mechanics: Bid vs. Ask, Tick Volume, and Spreads
What you see on a retail charting screen does not show the full execution picture. Currency platforms make display choices that every trader must understand to avoid unexpected losses.
The most important display factor is the bid-ask spread (the difference between the price to sell and the price to buy). Retail charting platforms display the bid price by default. The bid price is the highest price a buyer is willing to pay, and it is the price you receive when you sell. However, when you enter a buy trade, or when you buy back a short position to close it, your order fills at the ask price, which sits higher by the spread.
As documented by the CFA Institute, market makers quote a two-sided price where the offer or ask price is always higher than the bid price, creating the bid-ask spread that directly affects execution levels. If you open a short trade and place a stop loss above a swing high, your stop can trigger during sudden spread widening. This can happen even if the visible candle wick never reaches your line. You can make this price gap visible by turning on the "Show Ask Line" option in your platform settings.
Another critical mechanic is volume. In centralized stock markets, exchange feeds report the exact volume of shares traded. But the foreign exchange market is an over-the-counter (OTC) network without a single central clearinghouse.
According to the Bank for International Settlements, global OTC foreign exchange turnover averaged $9.6 trillion per day in their April 2025 survey. Because no single entity tracks every global trade, currency charts display tick volume — that is, the number of times price updates within a period — rather than total cash turnover. Tick volume measures market activity, but it does not tell you whether large institutional orders or small retail orders caused those price changes.
Finally, traders must account for daily rollover — that is, the process where open positions are extended to the next value date — typically around 5:00 PM Eastern Time. During rollover, liquidity often thins for a short period, which can cause spreads to widen. In addition, when markets open on Sunday evening, price can jump past Friday's closing level, creating weekend gaps that leap over technical chart levels.
Common Mistakes When Reading Forex Charts
Misreading currency charts usually stems from cognitive habits and ignoring execution realities rather than a lack of technical indicators. Beginners frequently fall into three common traps:
- Focusing entirely on low timeframes: Staring at 1-minute or 5-minute charts creates timeframe myopia. Price swings on these charts look massive, tempting traders to jump into low-probability setups that run straight into higher-timeframe resistance.
- Cluttering charts with too many indicators: Adding multiple indicators, such as three moving averages, RSI, MACD, and Bollinger Bands, creates conflicting signals. Too many tools obscure the actual candlesticks and lead to analysis paralysis. A clean chart focusing on price action and clear horizontal levels is easier to interpret.
- Treating chart formations as certain forecasts: Technical analysis deals in probabilities, not certainties. No candlestick formation or support level ensures that price will move in a specific direction. Traders who assume a chart setup cannot fail often skip stop-loss orders or risk too much capital on a single trade, leading to severe account drawdowns.
Conclusion
Reading a currency chart is a core skill that connects exchange rates, candlestick anatomy, and multi-timeframe structure into a clear market map. By paying attention to the bid-ask spread, tracking price action across higher timeframes, and understanding tick volume, you can make informed decisions based on market context rather than emotional impulse.
Once you feel comfortable identifying individual candlesticks and support zones, the logical next step is studying how multiple candles form broader chart patterns to signal potential continuations or reversals.
Trading currencies carries the risk of losing capital, particularly when using leverage that multiplies both gains and losses. Treat technical chart reading as a structured framework for managing risk and planning trades, rather than a system for predicting future prices.
Frequently Asked Questions
Why do different forex brokers show slightly different chart prices?
Because foreign exchange is a decentralized over-the-counter market without a single central clearinghouse, each broker pulls liquidity from different interbank price feeds. In addition, retail brokers apply their own variable bid-ask markups, meaning small price discrepancies of a few fractional pips between different charting platforms are common.
What is the best chart timeframe for beginners to practice reading forex?
The four-hour and daily timeframes are generally the most effective starting points for new traders. Higher timeframes filter out short-term market noise, reduce erratic price spikes, and make technical support and resistance levels easier to spot.
How do you identify whether a currency trend is weakening on a chart?
A weakening trend often reveals itself through smaller candlestick real bodies, elongated wicks pushing against the prevailing direction, or consecutive failed attempts to print higher highs or lower lows. When price momentum decelerates near major horizontal support or resistance levels, market participation is often shifting or taking profits.
What causes price gaps on Sunday when forex charts reopen?
Although retail trading platforms pause over the weekend, global geopolitical developments, economic statements, and emergency banking decisions continue to unfold. When interbank liquidity reconnects on Sunday afternoon, institutional market makers often reprice currency pairs quickly, causing retail charts to open at a price level noticeably higher or lower than Friday's closing quote.
Why does a stop-loss order trigger if the chart candle didn't touch the price line?
Most retail trading platforms plot the bid price by default, but a stop-loss on a short position is a buy order that executes at the ask price, which sits higher by the spread. During sudden market volatility or daily rollover, spread widening can lift the ask price to your stop level even while the charted bid line stays below it.
Keep learning
TA Masterclass
Reading charts one article at a time? Get the full method, in order.
10 lessons quiz
Start TA MasterclassThe Trader Faculty Team writes and reviews every guide together — pairing hands-on market experience with a curriculum-first approach to trading education. One good syllabus, taught in the order that makes you better.