Tweezer Top Candlestick Pattern: A Trader's Guide
Learn how to identify the tweezer top candlestick pattern at key resistance levels and how traders manage its risks. Read the full guide.
By Trader Faculty Team
Direct Answer
A tweezer top candlestick pattern is a two-candle bearish reversal formation that appears at the peak of an uptrend. It features two consecutive candles with matching high price points, which may signal that buyers failed to push prices higher and that selling pressure has taken control at resistance.
If you've searched for the "tweezer top candlestick pattern meaning," it describes two consecutive candles that share an identical (or nearly identical) high price level. Traders often read it as seller intervention after a period of buyer dominance, though it doesn't guarantee a reversal.
Some traders spot matching highs on a chart and immediately open a short position, only to get caught in a false breakout. Many traders look for a strong prior trend, key horizontal resistance, and clear confirmation before acting on this setup.
This guide explains how the tweezer top works, the market psychology behind it, and how traders manage risk around it. You may also see "tweezer top candlestick patterns" used for the same setup.
Quick Takeaways
- The tweezer top is a two-candle bearish reversal pattern defined by two consecutive candles sharing matching high price points at the top of an uptrend.
- The first candle reflects strong buying momentum, while the second candle encounters heavy selling pressure at the exact same high level before closing lower.
- Stronger signals often come with validation from horizontal supply zones (price areas where sellers have stepped in before), overbought momentum indicators, or a surge in second-candle volume.
- Conservative traders wait for a third confirmation candle to close below the pattern's low before entering a short position.
- Some traders place a stop-loss slightly above the shared high of the pattern to guard against volatility spikes and false breakouts.
What Is a Tweezer Top Candlestick Pattern?
This formation consists of two consecutive candles with matching high prices. It typically appears at the end of a bullish run and suggests the current upward trend may be losing momentum.
The Two-Candle Structure

- First Candle: A strong bullish candle that continues the prevailing uptrend. Buyers remain in control and push the price to a new high.
- Second Candle: A bearish candle that opens near the previous close, rallies to touch the exact same high price as the first candle, and then reverses downward to close lower.
Matching Wicks vs. Matching Bodies
The key defining feature of the tweezer top is the matching high price level. This high point can be formed by:
- Matching Upper Wicks (Shadows): Both candles reach the same upper price level via wicks (the thin lines above a candle's body), showing that buyers were rejected at that price twice.
- Matching Real Bodies (the thick part of each candle): The open or close of the two candles forms the same high, which suggests strong rejection at that level.
While exact price alignment is ideal, minor variations of a few ticks or pips (tiny price increments) are common in live trading because of volatility and spreads.
The Market Psychology Behind the Pattern
Understanding why a tweezer top forms helps traders evaluate the strength of the signal rather than relying solely on chart shapes.
- Buyer Confidence: On the first candle, buyers drive the market upward with strong momentum, expecting the trend to continue. The candle closes near its high, reflecting clear bullish control.
- First Rejection: On the second session, buyers try to push prices even higher. But as price reaches the previous high, it may trigger a large block of sell orders sitting at resistance.
- Shift in Momentum: The influx of selling supply absorbs the remaining buy orders. Buyers fail to hold price above the previous high, sellers take control, and the candle closes lower.
- Buyer Exhaustion: The failure to break higher suggests buying demand has faded at that level. As early buyers sell to lock in profits, selling pressure can increase and may accelerate a reversal.
How to Identify a Stronger Tweezer Top
Not every pair of matching highs creates a useful setup. To filter out market noise, traders often use a 4-point checklist:
- Prior Uptrend: The pattern is usually read after an established upward move. Two matching highs inside a choppy horizontal range or a sharp markdown (a fast drop) don't make a valid tweezer top.
- Structural Resistance Confluence (several signals lining up): Tweezer tops that line up with existing levels, such as daily resistance, a Fibonacci retracement level, or a moving average, are often given more weight.
- Volume Surge on Second Candle: Higher volume on the second bearish candle may suggest heavy institutional supply (selling by large players) entered at the matching high, though volume alone isn't proof.
- Overbought Technical Indicators: Momentum oscillators like the Relative Strength Index (RSI) or Stochastic Oscillator can add context. Some traders give the pattern more weight if RSI shows overbought conditions (above 70) or bearish divergence (price making a high while RSI doesn't).
Tweezer Top vs. Double Top: Key Differences
While both patterns feature two price peaks at a similar level, they differ in timeframe, structure, and how traders confirm them.
| Feature | Tweezer Top | Double Top Chart Pattern |
|---|---|---|
| Candle Count | Exactly 2 consecutive candles | Many candles |
| Time Horizon | Short-term signal | Longer-term structural change |
| Middle Trough | No trough between candles; they sit side-by-side | Features a distinct trough (neckline) between two peaks |
| Confirmation Point | Third candle close below pattern low | Breakdown and candle close below the neckline |
| Target Scale | Nearest short-term support level | Often a measured move based on the pattern's height |
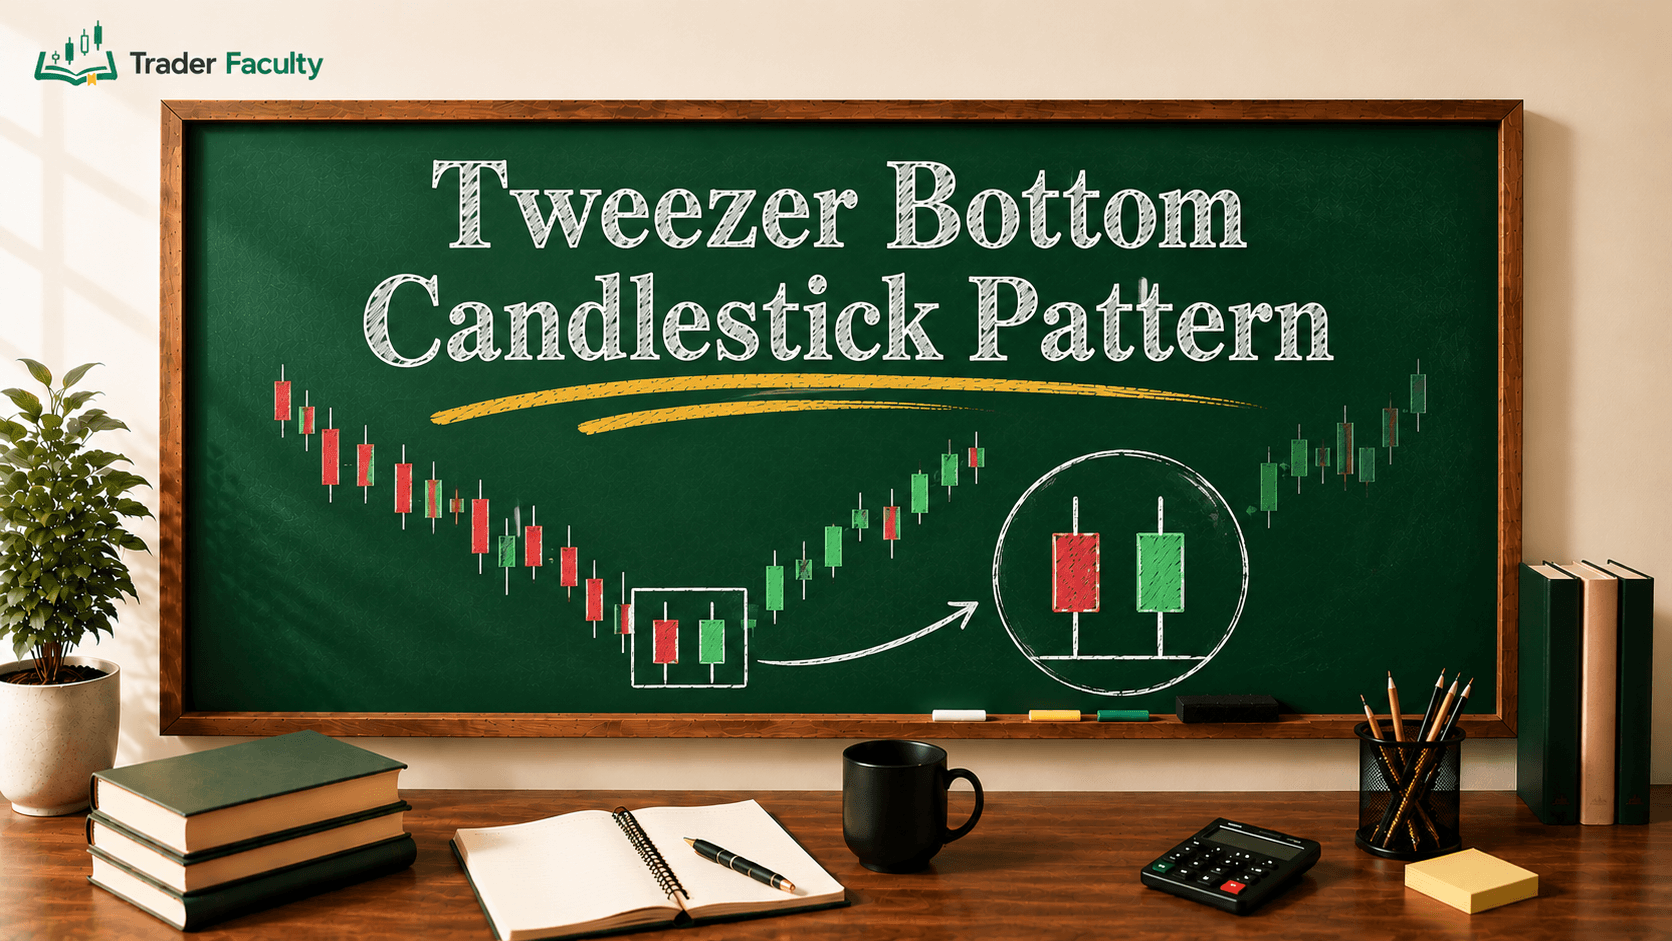
If you're looking for the inverse bullish setup that forms at market bottoms, read our guide to the tweezer bottom candlestick pattern to see how buyers may absorb selling pressure at support.
Example Step-by-Step Framework

This example framework is for study, not a recommendation. Trading the setup takes clear rules for entry, stop-loss placement, and profit taking, and no setup works every time.
1. Identify the Context
Scan for an asset trading in an uptrend that is approaching a major horizontal support and resistance zone or a dynamic technical level, such as a moving average.
2. Confirm Pattern Formation
Wait for the two-candle structure to complete. Ensure the high of Candle 2 matches the high of Candle 1 within a tight price margin.
3. Wait for Confirmation
To avoid false breakouts, many traders don't act while the second candle is still forming. They wait for a third confirmation candle to close below the low of the second candle.
4. Execute Entry and Set Stop Loss
- Entry: One example is a short entry at the close of the confirmation candle (or on a minor pullback to the low of the tweezer structure).
- Stop Loss: A trader might place the stop-loss a few pips (or ticks) above the shared matching high, adjusted for the market's volatility. That level invalidates the idea if price breaks above the resistance zone.
5. Define Take-Profit Targets
A trader might set a primary profit target at the nearest swing low or key horizontal support level. Some traders aim for a risk-to-reward ratio of at least 1:2, but that alone doesn't ensure profits over time.
Here's an illustrative example: a stock rises to $50.00 on Monday and closes at $49.80, then on Tuesday opens near $49.80, rallies to $50.00 again, and closes at $49.40. The matching $50.00 highs form the tweezer top. If a confirmation candle closes at $49.20, a stop-loss at $50.10 would risk $0.90 per share, and a 1:2 target would sit at $47.40. These numbers are for illustration only, and past performance doesn't guarantee future results.
Common Mistakes to Avoid
- Trading in Low-Liquidity Markets: In low-liquidity conditions or off-session hours, slippage (getting a worse fill than expected) and wide spreads can create false matching highs that lack real selling behind them.
- Ignoring the Prior Trend: Using a tweezer top in a strong downtrend or flat range may reduce its reliability, because the pattern is meant to reverse an existing uptrend.
- Early Execution: Opening a short position while the second candle is still active is risky. Price can spike higher before the session closes, which would invalidate the setup.
- Placing Stop Loss Too Tight: Setting a stop-loss exactly on the matching high without allowing for volatility can get you stopped out by minor wick spikes before price turns lower.
Conclusion
The tweezer top is a simple two-candle structure that can help traders spot potential bearish reversals at key resistance levels. Matching highs may point to buyer exhaustion and seller intervention, and the pattern tends to be more useful when combined with volume confirmation, momentum indicators, and sound risk control. No pattern is reliable every time, and past results don't guarantee future ones.
To build a well-rounded foundation in technical analysis, learn how to read candlestick charts and combine price action structures with broader market trend analysis. Use defined stop-loss limits and risk parameters, as market conditions can change quickly during high-volatility events.
Frequently Asked Questions
What does a tweezer top mean?
A tweezer top indicates possible buyer exhaustion at a resistance level. The first candle shows strong buying momentum, while the second hits the same high before being rejected downward, which some traders read as a potential trend reversal.
Does a tweezer top require opposite-colored candles?
Yes, a classic tweezer top has a bullish first candle followed by a bearish second candle. The key requirement is that both candles share the same high, either through their upper wicks or real bodies.
How do you trade a tweezer top?
As an example for study, some traders wait for a third confirmation candle to close below the second candle's low. They might then consider a short position on that close with a stop-loss a few pips (or ticks) above the matching high. This isn't a recommendation, and no setup works every time.
What is the difference between a tweezer top and a double top?
A tweezer top is a two-candle, short-term pattern whose highs sit side by side. A double top forms over many candles, with a distinct trough and a neckline between the two peaks.
Where should you place a stop loss on a tweezer top?
Some traders place a stop-loss slightly above the highest point of the pattern, a few pips or ticks above the shared upper wicks, to allow for slippage and false breakouts. The right distance depends on the market's volatility.
Keep learning
TA Masterclass
Reading charts one article at a time? Get the full method, in order.
10 lessons quiz
Start TA MasterclassThe Trader Faculty Team writes and reviews every guide together — pairing hands-on market experience with a curriculum-first approach to trading education. One good syllabus, taught in the order that makes you better.