Index Trading Strategy: How to Trade Market Baskets
Learn how an index trading strategy works, key setups, and rules to manage downside risk. Read the full guide.
By Trader Faculty Team
Direct Answer
An index trading strategy is a systematic method for speculating on the price movements of a basket of equities rather than picking individual stocks. Traders use instruments like index futures, CFDs, and ETFs to execute trend-following, breakout, or mean-reversion setups driven by broad macroeconomic data. This approach removes single-company earnings risk while requiring disciplined position sizing to manage derivative leverage and session volatility.
An index trading strategy is a rule-based plan for buying or selling a basket of equities, such as the S&P 500 or DAX 40, through derivatives or exchange-traded funds.
Many traders get frustrated when unexpected quarterly earnings reports or sudden company headlines trigger sharp losses in single stocks. Trading an entire market index helps remove that company-specific risk, but it introduces session gap risks and broad market swings. This guide explains how index trading works, the core setups for day and swing traders, and the rules needed to manage downside risk.
Quick Takeaways
- Index trading strategies focus on entire stock baskets rather than individual company shares, removing single-stock earnings surprises.
- Most major stock indices use market-cap weighting, meaning a handful of mega-cap companies can drive the entire index trend.
- Traders use index futures, CFDs, or ETFs to execute directional trend, breakout, or mean-reversion setups.
- Managing position size and leverage is essential because derivative contracts can produce fast losses during volatile market opens and macro data releases.
What Is an Index Trading Strategy? Definition and Meaning
An index trading strategy is a systematic method that traders use to speculate on the price direction of a broad equity benchmark rather than picking individual stocks. If you want to understand what is index trading strategy in practice, the core concept centers on collective market movement. The index trading strategy meaning comes down to treating a selected group of equities as a single tradable asset.
Active index trading differs from passive index investing. A passive investor buys index funds to hold for years, aiming to capture the long-term growth of the broader economy. In contrast, an active index trader holds positions for minutes, hours, or days. The goal is to capture short-term price momentum, intraday volatility, or swings between key support and resistance levels.
This difference also changes what drives your trades. When you trade an individual stock, tracking company earnings reports, executive departures, debt levels, and competitor actions becomes essential. With an index, your primary focus shifts to macroeconomic data, including central bank interest rate decisions, inflation figures, gross domestic product (GDP) growth, and employment reports. A shift in macroeconomic policy often moves all major index components at once, creating sustained trends across the entire market.
How Stock Indices Work: Weighting, Mechanics, and Tradable Instruments
Stock indices track the performance of a defined group of shares, but the way each company is weighted changes how the index moves. In a market-capitalization-weighted index, larger companies have a much bigger impact on the price. As outlined by the US Securities and Exchange Commission, market indexes often use market capitalization to decide each security's weight. Securities with a higher market capitalization account for a greater share of the overall value of the index, as in major equity benchmarks like the S&P 500.
Here, market capitalization (market cap) — that is, the total market value of a company's outstanding shares — determines its influence. If the top five tech firms make up a large share of the index, their collective direction can pull the entire index upward. This can happen even if most smaller member companies are falling. Understanding this weighting prevents you from assuming that a rising index means every stock inside it is gaining.
Because an index is a mathematical calculation, you can’t buy or sell the cash index directly. Instead, you trade through specific financial instruments:
- Index Futures: Standardized exchange-traded contracts where buyers and sellers agree on a price today for settlement on a future date. They offer deep liquidity, transparent order books, and nearly 24-hour access. Common contracts include the E-mini and Micro E-mini S&P 500. Each tick — that is, the smallest price increment a contract can move — has a fixed dollar value.
- Index CFDs (Contracts for Difference): Retail derivative contracts that mirror cash index prices. CFDs allow flexible position sizing, making them accessible for smaller account balances. However, holding a position overnight incurs a swap fee — that is, an interest charge for financing the leveraged trade.
- Index ETFs (Exchange-Traded Funds): Tradable funds that hold the underlying basket of stocks and trade on stock exchanges like regular shares. They don’t expire, carry lower leverage, and work well for multi-week swing strategies.
Before trading index futures or CFDs, confirm that your broker is licensed by a recognized financial regulator in your jurisdiction, since protections for your funds can vary significantly between regulated and unregulated providers.
Execution also depends on trading hours. Index futures trade nearly around the clock, but trading volume and volatility peak during the cash market open. In the United States, for example, that means 9:30 AM to 4:00 PM Eastern Time. Sharp moves in the overnight session can create price gaps at the cash open, which can jump past standard orders.
Core Index Trading Strategy Setups: Trend, Breakout, and Pullback

To see an index trading strategy explained clearly, look at how technical systems capture index volatility across different market sessions. Because broad indices reflect institutional money flows, they often form cleaner technical patterns than volatile small-cap stocks.
1. Trend Following with Moving Average Alignment
Equity indices tend to trend for extended periods when institutional investors allocate capital to equities. A simple trend strategy uses two moving averages on a 1-hour or 4-hour chart: the 50-period exponential moving average (EMA) and the 200-period EMA.
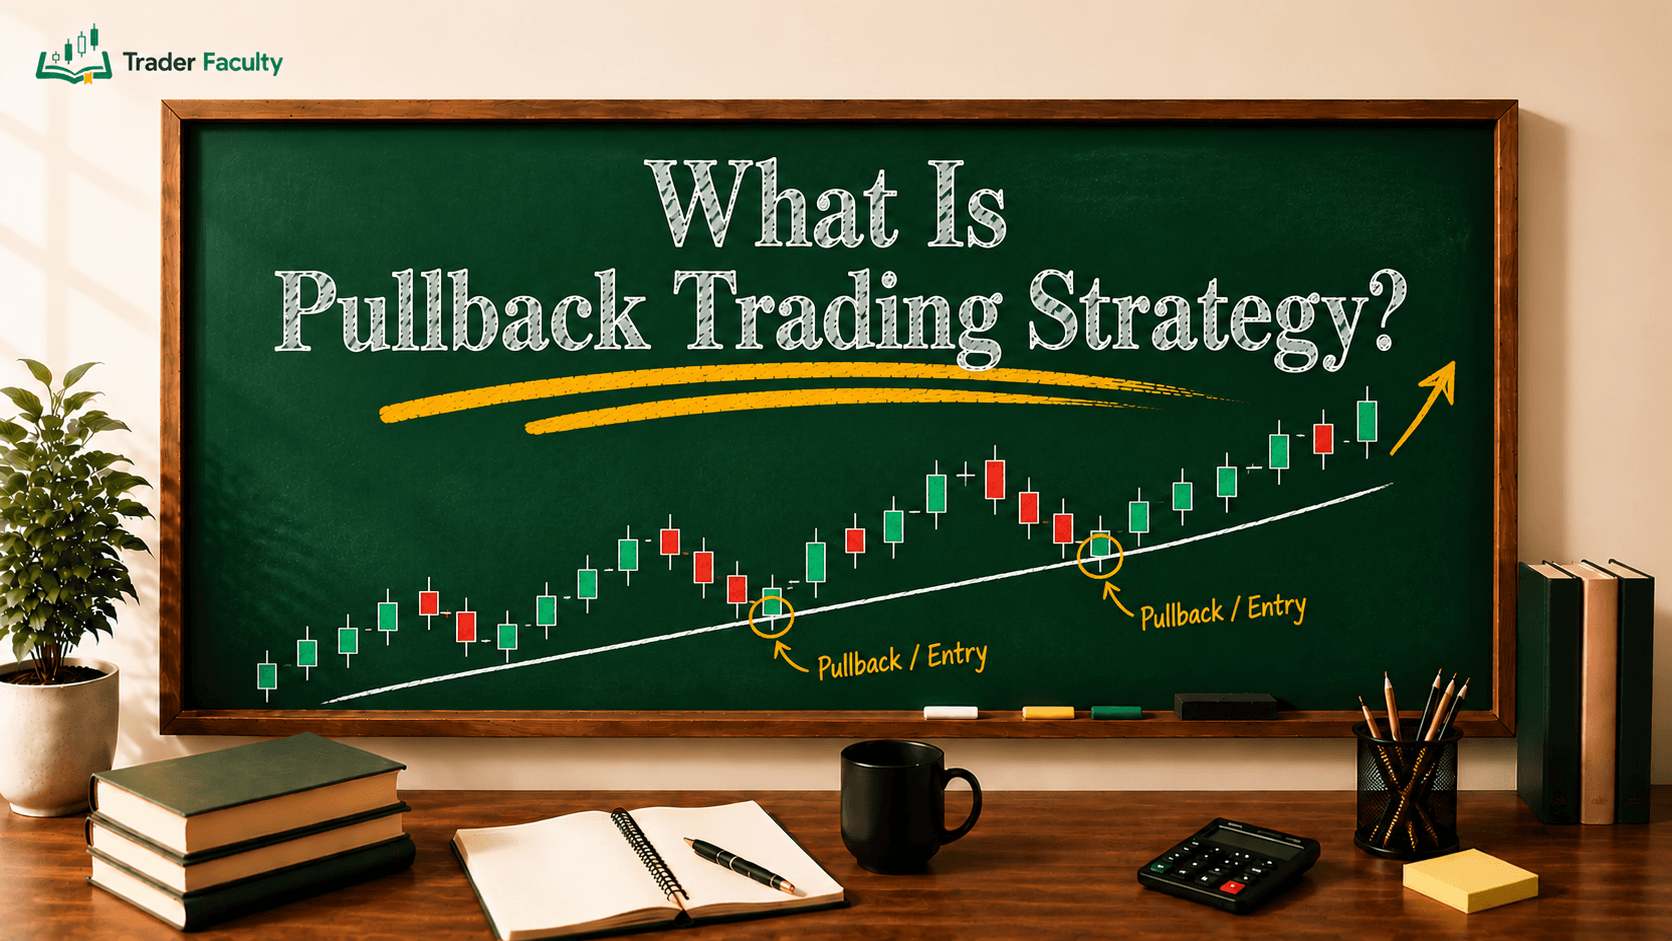
Entry: A long setup forms when the 50 EMA sits above the 200 EMA for an uptrend. The trigger comes when price pulls back to touch the 50 EMA and forms a bullish candlestick rejection during regular trading hours.
Risk & Exit: A stop-loss typically sits just below the recent swing low. The profit target usually runs at least two times the risk, or the stop trails along the 50 EMA until price closes below it.
2. The Opening Range Breakout (ORB)
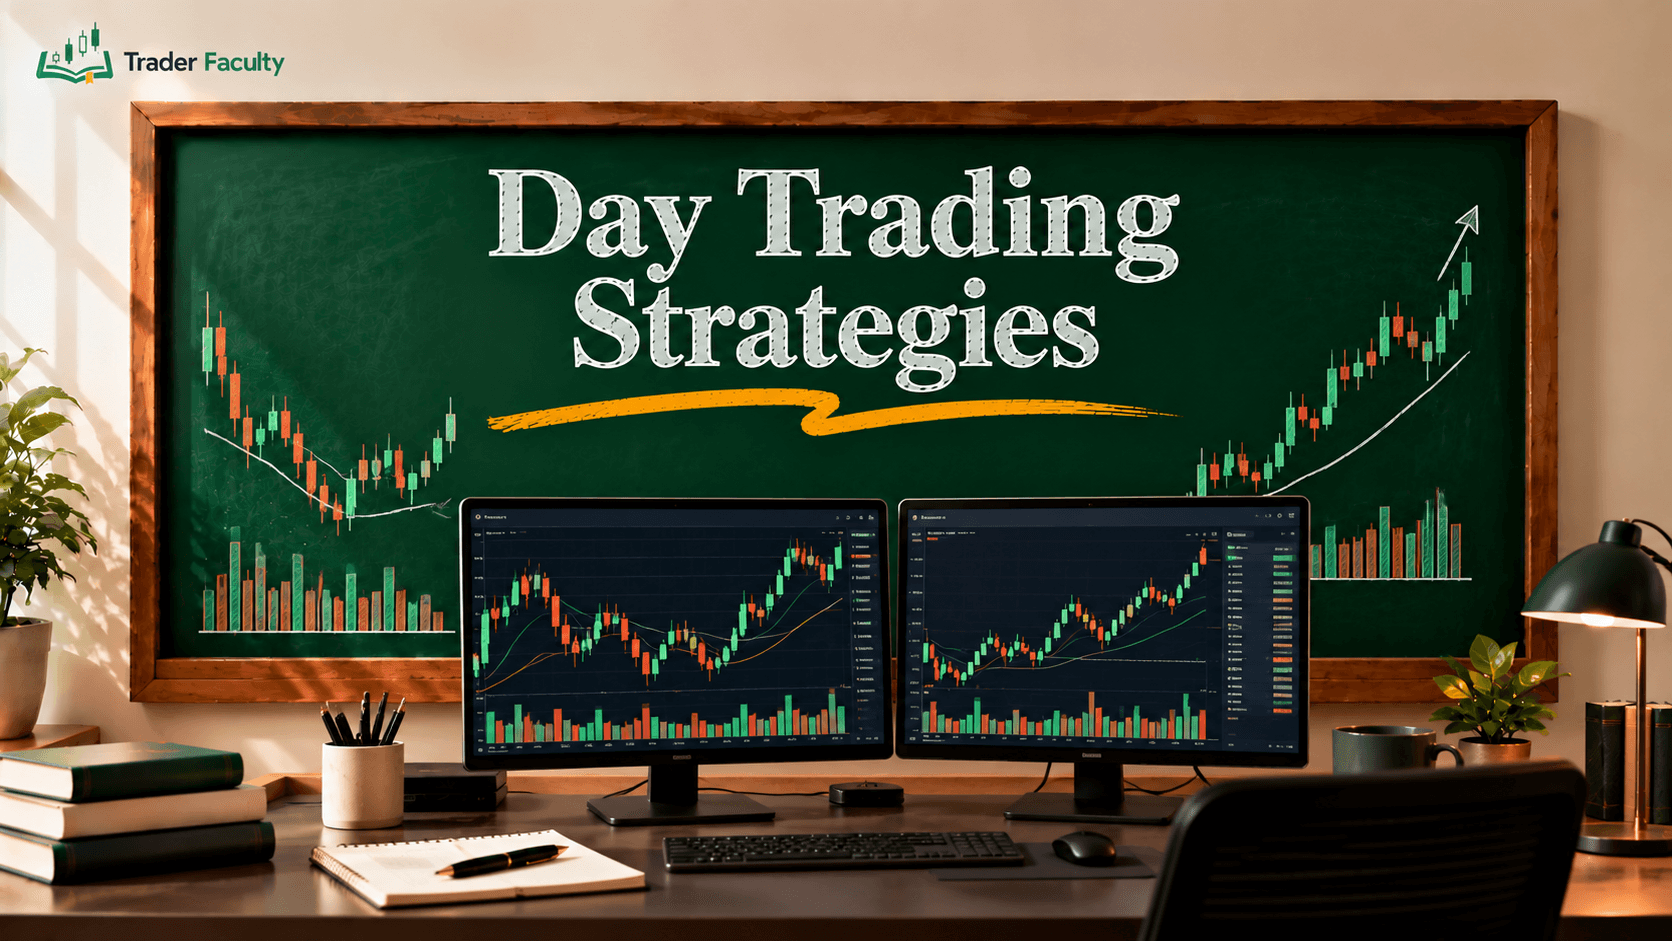
The opening 15 to 30 minutes of the regular cash trading session brings the highest volume of the day as overnight orders fill. The opening range breakout strategy aims to capture the directional trend established during this surge.
Entry: The setup marks the high and low of the first 15 or 30 minutes after the cash open. A long signal appears when a subsequent candle closes above the opening range high with rising volume. A short signal appears when price breaks below the opening range low.
Risk & Exit: Invalidation happens fast — if price reverses back inside the opening range, the trade is typically closed right away. The stop-loss usually sits at the midpoint of the opening range or at the opposite boundary.
3. Mean-Reversion Pullbacks to Support
Indices frequently pull back toward key structural levels after extended moves. In an established macro uptrend, sharp morning sell-offs often present short-term buying opportunities near prior session highs or breakout zones.
Entry: The setup looks for an area where prior resistance turned into support. A signal also needs momentum indicators showing an oversold condition — that is, price dropped so fast that a temporary bounce becomes likely. It forms when price tests the support level and forms a reversal candle.
Risk & Exit: The target is typically the recent session high, with a stop-loss below the structural support zone. If price breaks support with high volume, the trade is usually closed without waiting.
Index Trading vs. Single-Stock and Forex Trading
Choosing between trading equity indices, individual company shares, or currency pairs comes down to volatility drivers, liquidity, and your preferred holding period.
Single stocks carry single-company risk. An unexpected earnings warning, executive resignation, or regulatory penalty can cause an individual stock to drop 15% or more overnight. An index spreads this risk across dozens or hundreds of businesses. While an individual stock can go to zero, a broad national index can’t go to zero unless the entire economy collapses.
Forex trading, meanwhile, deals with currency pairs driven by interest rate differentials between two central banks. Currencies often spend long periods in sideways ranges. Equity indices, on the other hand, show stronger directional trends over months and quarters due to economic expansion. For example, while an active EUR/USD strategy tracks interest rate spreads and currency trends, index strategies track corporate growth and broader market sentiment.
Common Pitfalls in Index Trading and How to Manage Risk
Active index trading offers deep liquidity, but ignoring market mechanics and derivative leverage can lead to rapid account losses. Successful traders focus heavily on defensive risk rules.
1. Using Excessive Derivative Leverage
Because index futures and CFDs allow high leverage, beginner traders often take positions that are too large for their account size. On a standard E-mini S&P 500 contract, a 10-point move represents $500. A normal daily swing can wipe out an undercapitalized account in minutes. Position sizing based on a fixed dollar risk amount — typically 1–2% of account balance — tends to work better than sizing off the broker's minimum margin.
2. Holding Leveraged Trades Through Session Gaps
Holding day trading positions overnight exposes you to session gaps. If negative geopolitical news or bad earnings from a mega-cap company break after the cash market close, the index futures may open several percent lower the next morning. Your stop-loss won’t execute at your designated price if the market gaps past it. This creates unexpected slippage — that is, the difference between your planned exit price and your actual execution price.
Intraday strategies typically call for closing positions before the cash session ends.
3. The Mega-Cap Concentration Blind Spot
Assuming an index is safe because it holds 100 or 500 stocks is a dangerous blind spot. In recent years, data from S&P Dow Jones Indices has shown that the top ten companies in the S&P 500 can represent more than 30% of the index's total value. When market breadth is weak — meaning only a few tech giants are rising while most other stocks are falling — the index trend is fragile. Market breadth indicators can help confirm whether a rally has broad participation.
4. Front-Running High-Impact Macro Announcements
Attempting to trade seconds before a US Consumer Price Index (CPI) report, Non-Farm Payrolls release, or Federal Reserve interest rate decision is essentially gambling. Market makers often widen spreads and pull liquidity from the order book right before the release. This causes violent price swings in both directions that can trigger stop-losses on both sides before establishing a real trend. Initial volatility often needs to settle before a position makes sense.
Conclusion
A disciplined index trading strategy gives you a systematic way to participate in broader market trends without exposing your portfolio to individual company shocks. You might focus on opening range breakouts during the morning cash session, or prefer swing pullbacks along moving averages. Either way, your long-term results depend on respecting index weighting, session liquidity, and position sizing.
To expand your trading knowledge beyond market baskets, explore our complete guide to trading strategies to see how different systems fit distinct asset classes. If you are ready to design and test your own rules, the Build Your Trading System course walks you through structuring risk limits, entry criteria, and trade management.
Trading derivatives involves the real risk of losing capital. Sharp market swings can lead to quick drawdowns — that is, the drop from a trading account’s peak value to its lowest point. Treat these frameworks as educational tools to build your own tested rules rather than personal financial advice.
Frequently Asked Questions
Is index trading suitable for beginners?
Index trading can be suitable for beginners because it eliminates single-company earnings shocks and bankruptcy risk, but beginners must be cautious with derivative instruments like futures or CFDs, which offer high leverage. Starting with index exchange-traded funds (ETFs) or micro contracts with strict position sizing allows new traders to learn broad market mechanics without exposing their accounts to rapid liquidation.
Which stock index is best for day trading?
The S&P 500 and Nasdaq 100 are among the most actively traded indices for day trading, thanks to their deep liquidity, tight bid-ask spreads, and reliable volume. Traders seeking higher volatility and faster price swings often prefer the tech-heavy Nasdaq 100, while those looking for balanced, steady trends across diversified sectors typically focus on the S&P 500.
Can you trade stock indices 24 hours a day?
Most major index futures trade nearly 24 hours a day from Sunday evening through Friday afternoon. However, the best liquidity and cleanest price trends occur during the regular cash market session, such as 9:30 AM to 4:00 PM Eastern Time in the United States. Trading during off-peak overnight hours often involves wider spreads and sudden news-driven gaps.
How does dividend payout affect an index trading strategy?
When individual stocks within an index pay dividends, the cash index price adjusts downward on the ex-dividend date. If you hold a long position in an index CFD or derivative, your broker typically credits your account with a dividend adjustment. If you hold a short position instead, your account is debited, which can increase holding costs for swing traders.
What is the minimum capital required to trade index futures?
Capital requirements depend on whether you trade standard, E-mini, or Micro E-mini contracts. Day trading margins for Micro E-mini contracts can be as low as $50–$100 per contract with some brokers. Even so, maintaining a buffer of at least $1,000–$2,000 is recommended to absorb normal intraday price swings and maintain prudent risk management.
Keep learning
Build Your Trading System
Turn scattered tactics into one system you can actually follow.
8 lessons quiz
Build your systemThe Trader Faculty Team writes and reviews every guide together — pairing hands-on market experience with a curriculum-first approach to trading education. One good syllabus, taught in the order that makes you better.