What Is an Economic Indicator? A Beginner’s Guide to Macro Statistics
Learn what an economic indicator is and how macro statistics impact market volatility. Read the full guide.
By Trader Faculty Team
Direct Answer
An economic indicator is a quantitative statistical metric published by government or financial institutions to measure a country's overall economic health and performance. These data points—including GDP, inflation, and employment figures—help central banks set monetary policy and provide market participants with objective insights to evaluate financial asset trends.
An economic indicator is a quantitative statistic that measures economic performance and serves as a fundamental measure of a country's economic health. Governments, central banks, and financial market participants use these metrics to track broader business conditions.
Have you ever seen currency prices jump violently within seconds after a news release, leaving you wondering what just happened? You aren't alone. Financial markets move rapidly when economic data drops, but trading these releases without understanding how numbers are interpreted usually leads to costly mistakes. This guide explains how economic indicators function, how they shape central bank policy, and how to read them without getting caught off guard.
Quick Takeaways
- Financial markets react to the gap between actual published numbers and market consensus expectations, rather than raw headline figures alone.
- Indicators fall into three operational categories—leading, coincident, and lagging—each serving a distinct role in diagnosing market cycles.
- Major releases often experience subsequent data revisions, making initial price surges volatile and potentially misleading.
- Economic data drives central bank interest rate decisions, directly influencing asset prices across forex, equities, and bond markets.
What Is an Economic Indicator?
An economic indicator is a standardized data point released by government agencies, central banks, or independent research organizations to measure current or future financial conditions. These statistics capture underlying economic factors—such as consumer spending, industrial production, employment levels, and price volatility—giving market participants an objective gauge of economic strength.
For traders and investors, analyzing these metrics forms the core foundation of fundamental analysis. Rather than focusing solely on chart patterns or technical indicators, fundamental traders evaluate macroeconomic health to determine whether a currency, stock index, or commodity is undervalued or overvalued. By synthesizing broad macroeconomic indicators, market participants can build a structured framework for anticipating long-term market trends rather than reacting blindly to daily noise.
The 3 Types of Economic Indicators: Leading, Lagging, and Coincident

Economic indicators do not all move at the same time. To analyze them effectively, economists and traders group statistics based on when they change relative to the overall economy.
Leading Indicators
Leading economic indicators change direction before the broader economy shifts. They act as an early warning system, offering insight into where economic growth or contraction is headed over the coming months. Common examples include purchasing managers' indexes (PMI), building permits, stock market indexes, consumer confidence surveys, and the heavily watched inverted yield curve. Because they signal future activity, leading data strongly influences market sentiment and asset pricing well before official figures confirm a structural trend.
Coincident Indicators
Coincident indicators change at the exact same time as general economic activity. They provide a real-time snapshot of the economy's current state. Gross domestic product (GDP) is the primary coincident metric; taking time to learn what GDP is helps traders assess total national output as it occurs.
Other coincident metrics include retail sales and industrial production. These numbers confirm whether an economy is expanding or contracting right now.
Lagging Indicators
Lagging indicators only shift after an economic trend or structural change has already established itself. Rather than forecasting the future, lagging data confirms long-term directional moves. Inflation metrics are classic lagging tools—traders analyze consumer price reports to evaluate price pressures and understand what inflation is doing to consumer purchasing power. Other lagging metrics include unemployment rates and average duration of unemployment.
| Indicator Type | Timing Relative to Cycle | Primary Function | Representative Examples | Market Impact Horizon |
|---|---|---|---|---|
| Leading | Shifts before the economy turns | Forecasts future expansion or contraction | PMI, Housing Permits, Yield Curve | Medium to Long Term |
| Coincident | Shifts with the current economy | Measures real-time economic performance | GDP, Industrial Production, Retail Sales | Immediate to Medium Term |
| Lagging | Shifts after economic shifts occur | Confirms structural trends and policy impacts | Unemployment Rate, CPI, Prime Rates | Long Term / Policy Focused |
Core Macroeconomic Indicators Every Trader Should Know
To navigate economic calendars effectively, you must familiarize yourself with the specific metrics that command the most attention from global institutions.
Output and National Production
Economic output measures the total value of goods and services produced within a nation.
- Gross Domestic Product (GDP): The broadest metric of national production. Beyond headline growth, traders evaluate what real GDP indicates about output adjusted for inflation, while using what the GDP deflator measures to track broader price level changes across all domestically produced goods.
- Manufacturing & Services PMI: Monthly survey data reflecting business confidence, new orders, and operational activity.
Price Stability and Inflation Metrics
Inflation statistics measure how quickly purchasing power erodes, heavily influencing central bank policy.
- Consumer Price Index (CPI): Tracks changes in the price of a standard basket of consumer goods and services.
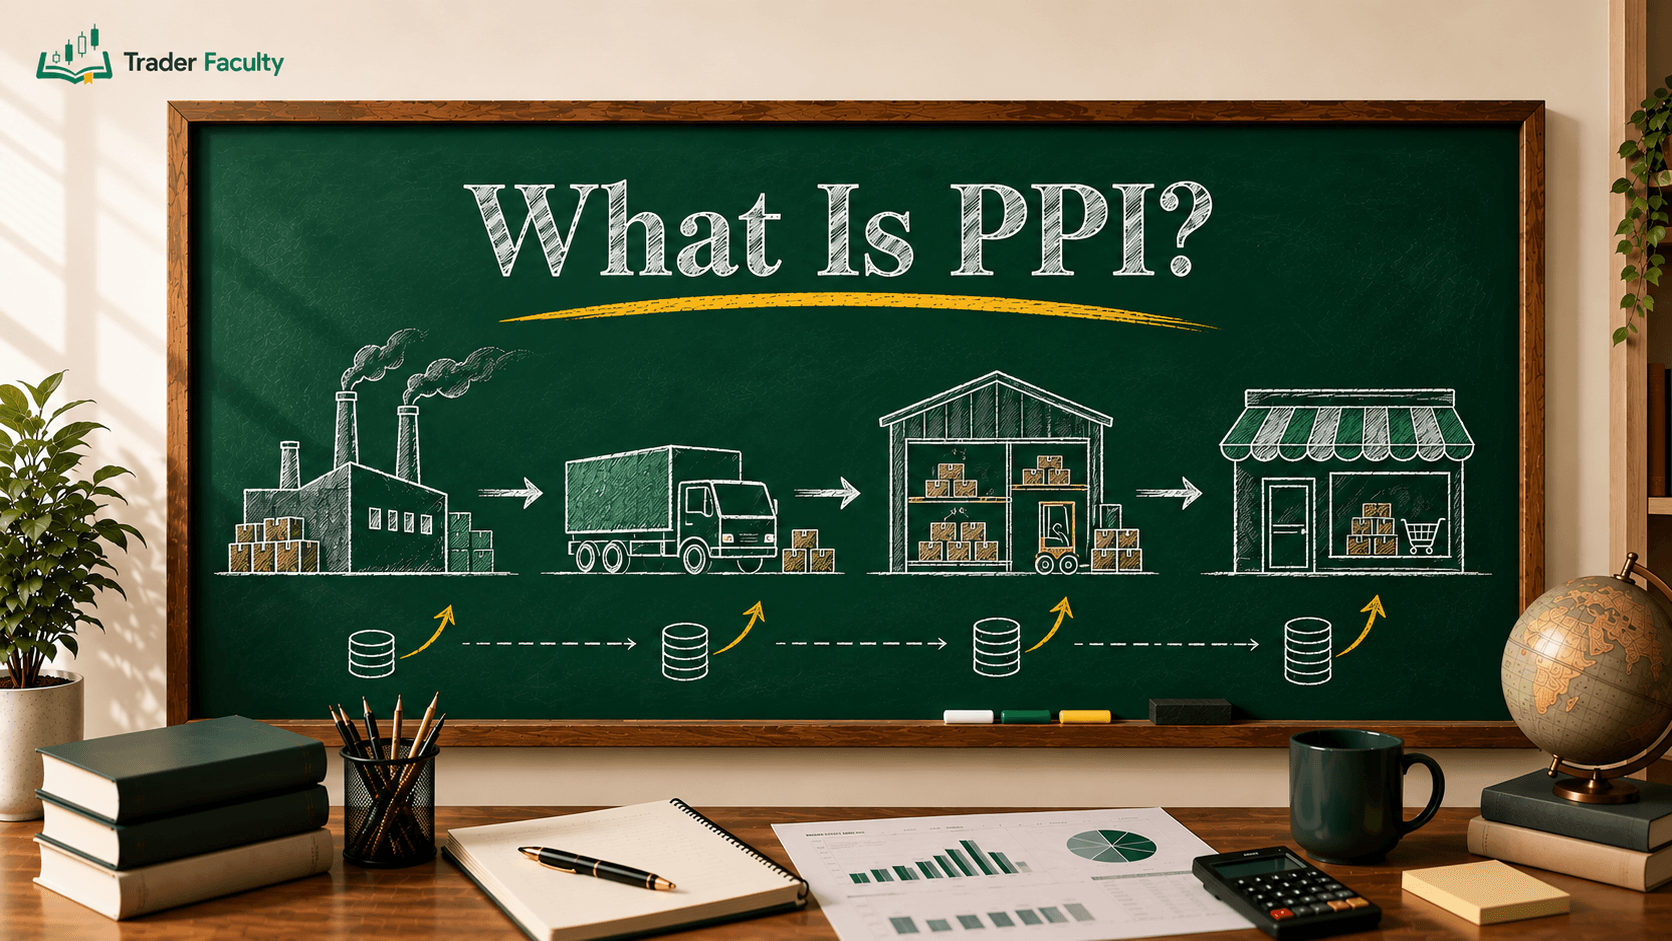
- Producer Price Index (PPI): Explores wholesale price changes before they reach consumers, tracking wholesale pressures through what PPI reflects at the manufacturing level.
- Inflation Dynamics: Understanding these prints requires distinguishing between consumer-driven spikes like demand pull inflation, supply disruption pressures like cost push inflation, or learning what causes inflation when money supply expands rapidly.
- Extreme Price Environments: Data also highlights extreme conditions, ranging from contracting price levels in what deflation represents to severe monetary collapses characterized by what hyperinflation causes.
Labor Market Metrics
Employment metrics highlight the financial health of households and corporate hiring strength.
- Nonfarm Payrolls (NFP): Released monthly in the United States, this report details what nonfarm payroll growth reveals about job creation, wage gains, and labor market heat.
- Unemployment Rate: Measures the percentage of the labor force actively seeking employment, providing critical context into how unemployment affects the economy by dampening consumer spending power.
Monetary Policy and Central Banking Rates
Central bank decisions serve as the primary bridge connecting economic data to market movements.
- Policy Interest Rates: Institutions like the Federal Reserve adjust benchmark rates and deploy tools like quantitative easing based on economic prints. Understanding what a central bank aims to achieve helps traders anticipate shifts in lending costs, such as what repo rate adjustments determine for institutional borrowing or what the discount rate sets for direct liquidity access.
- Digital Monetary Evolution: Beyond traditional rate adjustments, market watchers also evaluate structural developments, such as studying what central bank digital currency represents for future monetary implementation.
How Economic Indicators Move Financial Markets

Economic releases create substantial market volatility, but asset prices do not simply move up on good numbers and down on bad numbers.
The Expectations Engine: Consensus vs. Actual
Financial markets are forward-looking mechanisms. Long before an indicator is officially published, institutional analysts create consensus forecasts. Market prices reflect these expectations in advance.
- If a metric meets expectations, market price reaction is often minimal because the news was already "priced in."
- If a metric sharply beats expectations, prices revalue upwards rapidly.
- If a metric misses expectations, asset values frequently sell off regardless of whether the raw number was positive.
The Policy Transmission Mechanism
Economic indicators serve as diagnostic input for monetary and fiscal authorities.
- Interest Rates and Yields: High inflation figures prompt central banks to hike rates, showing how inflation affects interest rates in real-time. Higher interest rate expectations drive up fixed-income returns, directly dictating what bond yield trends offer across government debt instruments.
- Business Cycle Mapping: Accumulating data points allows market participants to locate the current phase of the business cycle. Reports reveal whether an economy is entering expansion, experiencing what a recession signals during contraction, undergoing stabilization through what fiscal policy measures government implements, or stuck in rare structural traps defined by what stagflation brings when high inflation meets stagnant growth.
Common Mistakes Beginners Make When Using Economic Indicators
Incorporating economic data into your trading framework requires discipline and an awareness of common analytical traps.
Pitfall 1: Headline Bias and Ignoring Data Revisions
Initial economic releases, known as headline prints, capture immediate news coverage. However, government agencies regularly revise these figures weeks or months later as complete data becomes available. Trading solely on an initial headline spike without looking at underlying sub-components—such as wage growth inside an employment report—often leads to entering trades right as the initial move reverses.
Pitfall 2: Treating Data as Isolated Signals
No single metric tells the entire story. A strong employment report might look bullish for an economy, but if accompanied by surging inflation and declining real wages, overall economic health may actually be deteriorating. Successful fundamental analysis requires evaluating indicators in combination rather than treating individual prints as isolated buy or sell signals.
Pitfall 3: Neglecting Risk Management During High-Impact Events
Trading during high-impact news releases exposes accounts to heightened volatility, rapid spread expansion, and slippage. Position sizes that feel manageable during quiet market hours can quickly generate outsized losses when unexpected economic prints hit the wires. Always adjust position sizing and respect stop-loss placement when trading around scheduled releases.
Conclusion
Economic indicators are essential analytical tools that convert complex macroeconomic activity into measurable data points. By serving as an objective measure of a country's economic health, these metrics allow traders to understand business cycle trends, anticipate central bank policy shifts, and evaluate price movements with fundamental context. Rather than attempting to predict exact news releases, focus on understanding how data compares against market expectations and fits into broader monetary trends to elevate your trading framework.
A notable scheduled event worth tracking on the economic calendar is the Jackson Hole Fed meeting, where central bank speeches often move markets even without a formal data release.
Frequently Asked Questions
What are the three main types of economic indicators?
The three main types are leading, coincident, and lagging indicators. Leading indicators (like purchasing managers' indexes and building permits) signal future economic shifts. Coincident indicators (like gross domestic product) measure real-time economic activity. Lagging indicators (like unemployment rates and consumer price inflation) confirm long-term economic trends after structural shifts have already taken place.
What is the most important economic indicator for traders?
While importance varies by market, Gross Domestic Product (GDP), Consumer Price Index (CPI), and Nonfarm Payrolls (NFP) are widely considered the most influential. GDP provides the master overview of economic growth, CPI directly dictates central bank inflation policy, and NFP measures employment momentum, driving rapid short-term market volatility across forex, stock, and bond markets.
Why do economic indicators cause market volatility?
Financial markets constantly price in future expectations based on institutional forecasts. When an official economic release differs significantly from consensus estimates, market participants must quickly reprice assets. The gap between the actual published number and market expectations—rather than the raw headline figure alone—triggers sharp buying or selling momentum and rapid price adjustments.
What is the difference between leading and lagging indicators?
Leading indicators shift prior to broad economic turns, providing predictive signals about where future growth or contraction is headed. In contrast, lagging indicators change only after an economic trend has established itself, serving primarily to confirm structural shifts and validate whether central bank monetary policies or broader economic cycles are functioning as intended.
How do economic indicators affect interest rates?
Central banks evaluate macroeconomic indicators to guide their interest rate decisions. Persistent high inflation or surging employment data often prompts central banks to raise policy rates to cool down the economy. Conversely, weak economic output or rising unemployment prompts interest rate cuts, directly influencing government bond yields, borrowing costs, and national currency values.
Keep learning
Fundamental Analysis for Traders
See how the economy actually moves your charts, step by step.
9 lessons quiz
Start the courseThe Trader Faculty Team writes and reviews every guide together — pairing hands-on market experience with a curriculum-first approach to trading education. One good syllabus, taught in the order that makes you better.