What Is Price Action? A Complete Guide to Chart Mechanics
Discover what is price action and how raw chart data maps out global supply and demand. Read the full guide.
By Trader Faculty Team
Direct Answer
Price action refers to the sequential movement of a financial asset's price over time on a clean chart framework. By tracking raw transaction execution data rather than lagging mathematical derivatives, it provides an unfiltered visual record of shifting supply and demand imbalances.
Price action is the sequential movement of a security's price plotted over a timeline, forming the baseline for tracking market trends and structural chart behavior without relying on lagging technical indicators. It serves as an unfiltered record of all transactional activity within an exchange, translating every market participant's decision into a clear visual map.
When you open a chart, it is easy to get overwhelmed by a colorful web of moving averages and oscillators. You spend your energy calculating mathematical derivatives instead of watching real transaction data. This guide breaks down the core elements of price charts, candlestick anatomy, and auction mechanics to help you build a clean, objective analytical foundation.
Quick Takeaways
- Raw price data provides the most immediate reflection of supply and demand imbalances, completely eliminating the time delay inherent in lagging indicators.
- A candlestick acts as a compressed summary of an auction, capturing localized market sentiment through the structural relationship between its opening and closing values.
- Market context always overrides standalone patterns; formations require confirmation from underlying structural trends and horizontal liquidity zones to remain actionable.
What Is Price Action Trading?
Price action trading is a technical methodology where a trader makes market decisions based purely on the historical and structural movements of prices on a clean chart. Instead of attempting to predict the future using mathematical indicators, this approach focuses entirely on reading what the market is actively doing right now.
This visual study serves as one of the core pillars of broader technical analysis, which assumes that all publicly available information and participant psychology are already reflected in the current market price. While traditional technical analysis can include everything from algorithmic indicators to complex quantitative models, price action strips the discipline down to its most fundamental element: the raw price execution stream.
When you look at a clean chart versus a cluttered one, the difference in clarity is stark. An indicator-heavy chart often causes analysis paralysis, as three different software inputs might give conflicting signals simultaneously. A price action framework eliminates this clutter, allowing you to observe the immediate battle between aggressive buyers and aggressive sellers without filter layers.
How Price Action Works: The Mechanics of a Bar
Price action works by recording the execution of transactions between market participants and mapping those data points across a fixed timeline. Every time an order is filled, it leaves a permanent print on the chart, meaning that every single bar or candlestick is a visual footprint of money moving through the market.
To read these footprints correctly, you must master the anatomy of a candlestick. Each candle provides a clear narrative of a specific session's auction using four essential metrics: the Open, High, Low, and Close (OHLC) values.

- The Open: The exact transaction price when the session timeframe begins.
- The High: The highest point supply was exhausted by aggressive buying during the session.
- The Low: The lowest point demand stepped in to halt aggressive selling during the session.
- The Close: The final transaction price when the session timeframe ends.
The area between the open and the close forms the candle body, while the thin lines extending to the high and low are the wicks or shadows. A green body signifies that the close was higher than the open, indicating net buying control, while a red body reveals that the close settled below the open, indicating net selling control.
Understanding this structure introduces you to the concept of timeframe fractality. A single four-hour candlestick does not just represent one solid move; it is a composite container holding 16 consecutive 15-minute candlesticks. Within that single candle, lower-timeframe micro-trends, consolidations, and reversals are constantly occurring, meaning the market functions like a nested Russian doll where smaller structures continuously build the larger picture.
Foundational Components: Support, Resistance, and Trends
Building a systematic framework around raw price movements requires tracking where the market changes direction and how it trends over time. Price action does not move randomly; it flows between established structural boundaries where market participants regularly re-evaluate value.
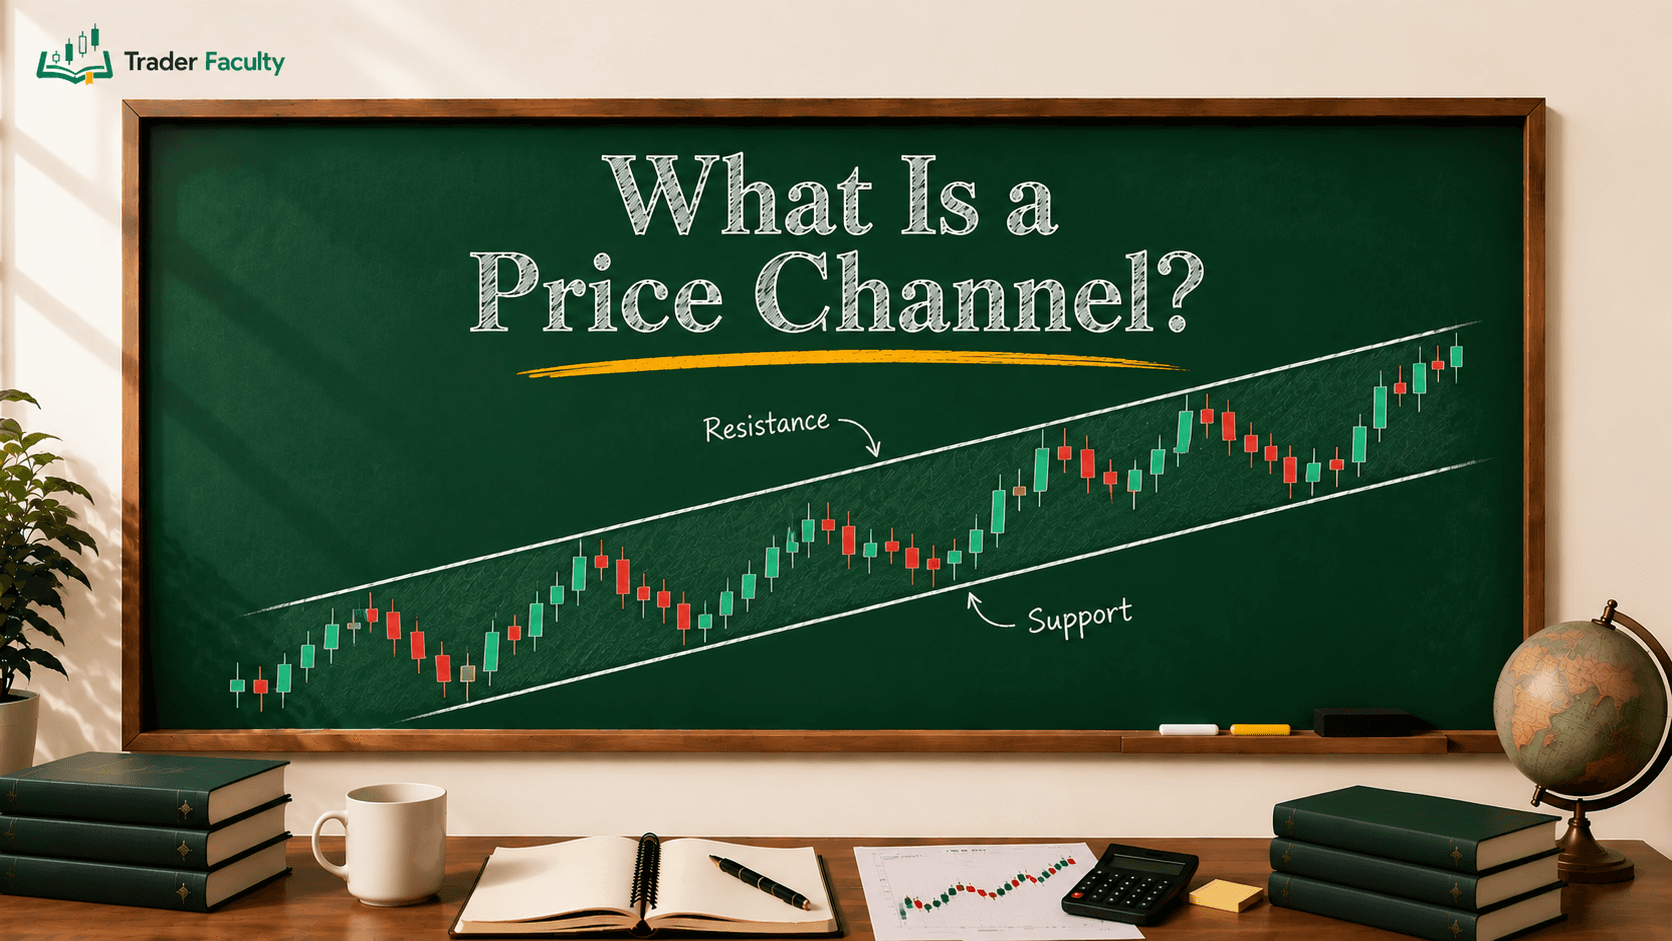
The most vital of these boundaries are support and resistance zones, which represent specific price floors and ceilings where supply and demand historically fall out of balance. A support zone is a horizontal area on your chart where buying interest has historically been strong enough to overcome selling pressure, causing a downward move to halt and reverse.
Conversely, a resistance zone is a ceiling where selling pressure has historically overwhelmed buying interest, capping upward advances. Spotting these zones allows you to identify where major pools of orders are clustered.
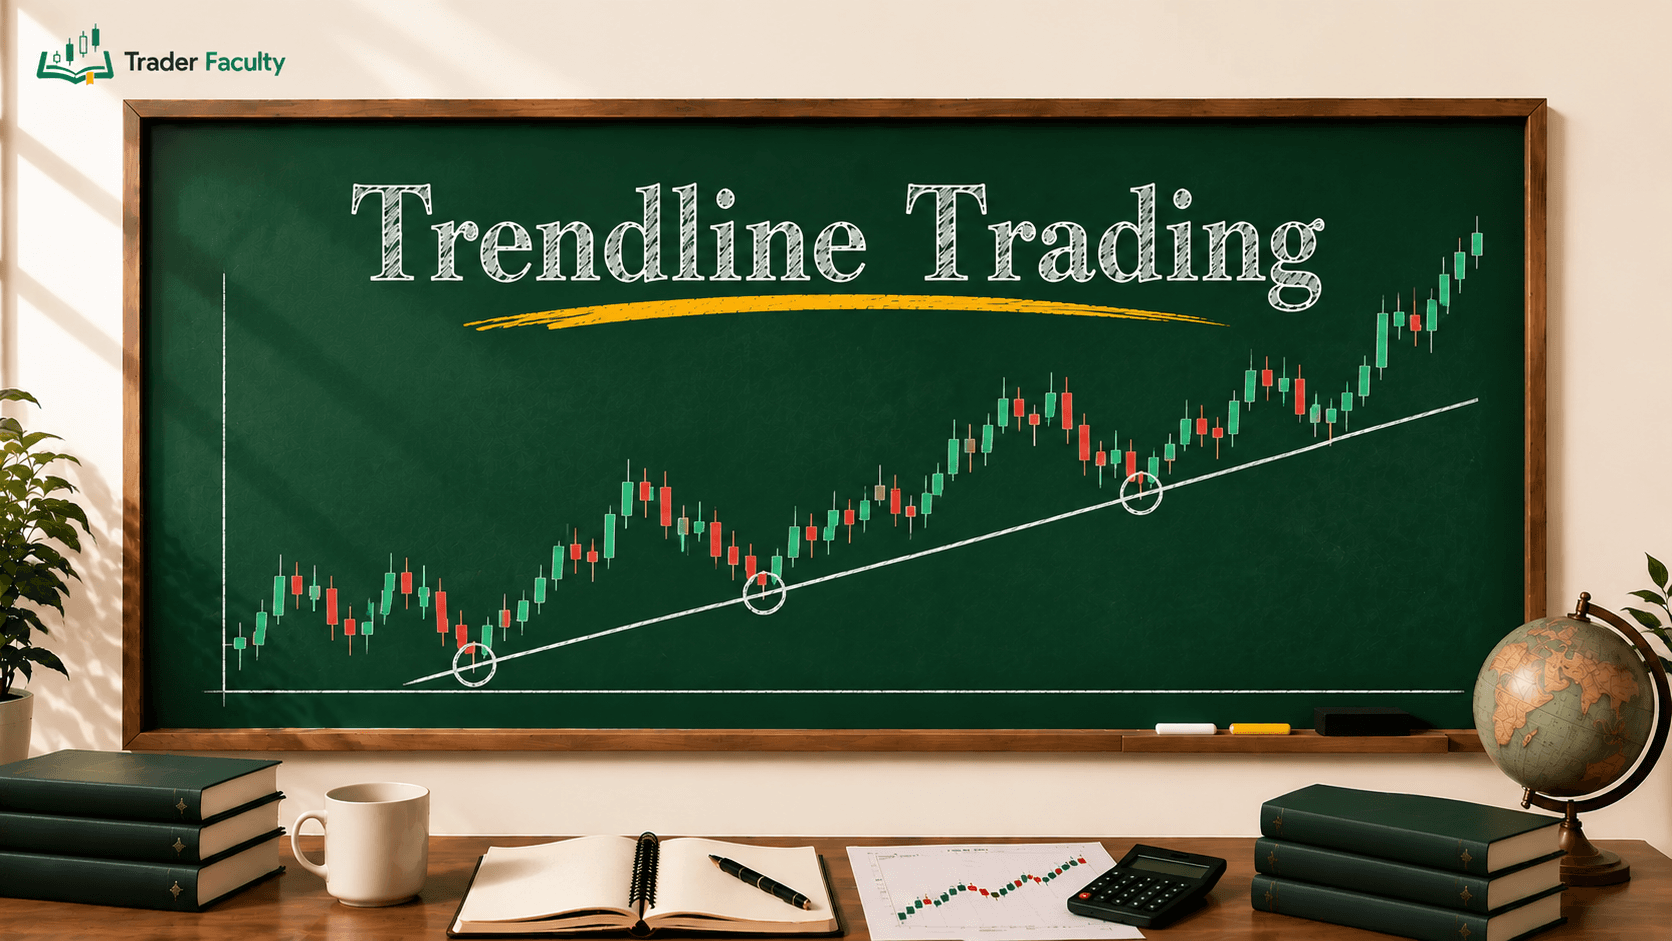
Once you identify these structural floors and ceilings, you can track the path the market takes between them by drawing clean trend lines. Instead of relying on a computer formula to tell you if the market is moving up or down, you use these manual lines to connect successive swing points on a chart. In an uptrend, you draw a line connecting the higher lows to visualize the ascending demand floor.
In a downtrend, you connect the lower highs to visualize the descending supply ceiling. This simple process allows you to evaluate directional momentum clearly without lagging software calculations distracting your focus.
Common Price Action Patterns and Strategic Frameworks
A cohesive strategy relies on identifying repeating visual formations that signal structural shifts in order flow. These formations, known as patterns, are not mathematical guarantees of future direction; rather, they are visual evidence of trapped market participants, sudden liquidity sweeps, or aggressive changes in short-term market control.
The Reversal Story: Pin Bars and Hammers
A pin bar or hammer is a single-candle formation defined by a very small body and a long, prominent wick extending to one side. Mechanically, this tells a story of complete rejection. For instance, a bullish pin bar shows that sellers pushed prices aggressively lower during the session, but buyers stepped in with overwhelming force, driving the price all the way back up to close near the open. This leaves a long lower wick, signaling that lower prices were firmly rejected.
The Momentum Shift: Engulfing Bars
An engulfing pattern consists of two candles where the second candle's body completely covers or engulfs the entire body of the preceding candle. A bullish engulfing pattern occurs when a small red candle is followed by a large green candle. This structural shift shows that the slow selling pressure of the first session was entirely erased by aggressive, overwhelming demand in the second session, indicating an immediate shift in short-term market control.
The Consolidation Phase: Inside Bars
An inside bar is a two-candle formation where the entire range (the high and the low) of the second candle sits completely within the high and low boundaries of the first candle. This formation represents a temporary contraction in volatility. The market is coiling, building up energy inside a brief consolidation phase before an eventual breakout occurs when buyers or sellers force price out of the initial container.
Comparing Core Price Action Formations
| Pattern Type | Structure | Underlying Market Logic | Contextual Focus |
|---|---|---|---|
| Pin Bar / Hammer | Small body with a long, extended wick on one side. | Aggressive rejection of a specific price level mid-session. | Look for execution directly at major historical support or resistance lines. |
| Engulfing Bar | A large body that completely covers the previous candle's body. | Sudden, overwhelming dominance of one side over the other. | Highly effective when initiating a new directional breakout from a range. |
| Inside Bar | A small candle completely contained within the previous candle's range. | Temporary volatility compression and market indecision. | Serves as a continuation framework ahead of a major trend extension. |
Context Over Patterns: Why Formations Fail
Price action formations fail frequently because retail traders often trade isolated candle shapes without verifying the overall market structure. A perfect bullish engulfing candle printed in the middle of a heavy, aggressive institutional markdown trend is highly likely to result in a losing trade. The chart pattern itself is meaningless without its surrounding context.
Market environments dictate how well a pattern performs. A trending market requires a completely different analytical filter than a low-liquidity horizontal range. During ranges, rejection patterns like pin bars thrive near the boundaries, while breakout patterns frequently fail. In strong trends, continuation patterns like inside bars yield cleaner transitions, while counter-trend reversal candles are regularly run over by the prevailing trend momentum.
Furthermore, high-impact macroeconomic news releases regularly introduce severe structural noise that invalidates standard technical setups. During an interest rate announcement or an employment data release, sudden large-scale institutional volume sweeps into the order books. This can create massive, erratic wicks that break support and resistance levels instantly, rendering existing price action candle formations completely irrelevant until the sudden volatility spikes subside.
Common Mistakes in Price Action Trading
A major pitfall for beginners is engaging in blind pattern-matching without checking the broader market structure first. Spotting a hammer candle on a low-timeframe chart and immediately clicking buy without checking if the daily trend is heavily down is a recipe for rapid drawdown. You must verify that the macro structure aligns with your micro execution setup.
Another frequent error is chasing late breakout entries out of an emotional fear of missing out (FOMO). When an aggressive green candle surges upward out of a consolidation zone, untrained traders often buy right at the absolute top of the extension. Price action principles show that extended moves regularly mean reversion or pull back to retest the broken breakout level, leaving late entrants highly vulnerable to execution slippage and immediate negative trade equity.
Finally, traders often disregard the drastic drop in liquidity that occurs during market off-hours. Price action patterns printed during dead zones—such as the late New York afternoon or the early Asian session for major currency pairs—suffer from low trading volumes. This lack of institutional participation creates erratic, unreliable price action noise that can easily trigger stop-loss orders before the true trend establishes itself during high-volume sessions.
Conclusion
Reading raw chart data is a dynamic, interpretive skill that requires continuous practice rather than treated as a mechanical, predictive cheat code. Candlesticks, trends, and key zones provide a highly structured window into the real-time shifts between supply and demand, but they never guarantee absolute future outcomes.
By focusing heavily on institutional context, learning to spot major liquidity zones, and respecting the underlying reality of pattern failures, you can steadily build an objective, clean approach to technical market analysis.
Frequently Asked Questions
What is the difference between price action and technical analysis?
Price action is a specific subset of broader technical analysis. While traditional technical analysis encompasses all forms of chart examination, including lagging indicators and quantitative models, price action strips away mathematical overlays to focus exclusively on raw transaction flow, market structure, and horizontal supply and demand boundaries.
Can you trade price action without any indicators?
Yes, many market participants trade exclusively using clean charts. Instead of filtering transaction flow through lagging indicators like moving averages or oscillators, pure price action strategies rely on interpreting raw open-high-low-close candlestick data, historical horizontal support zones, and manual trend lines to gauge real-time shifts in market momentum.
What are the most reliable price action patterns?
No price action formation guarantees a winning outcome, as their reliability depends entirely on market context. Formations like pin bars and engulfing candles show higher consistency when they develop directly at major institutional support or resistance levels within a confirmed higher-timeframe trend, rather than printing in isolation.
Why do price action strategies fail?
Price action strategies frequently fail when traders look at candlestick shapes out of context. A reversal pattern printed during an aggressive institutional markdown or inside a low-liquidity market off-hours often yields false signals. High-impact macroeconomic news releases also introduce random volatility noise that invalidates technical structures.
How do you identify market structure in price action?
Market structure is identified by tracking the sequence of major swing highs and swing lows on a chart. An uptrend is structurally defined by a series of successive higher highs and higher lows, whereas a downtrend consists of clear lower highs and lower lows, mapping out net directional order flow.
The Trader Faculty Team writes and reviews every guide together — pairing hands-on market experience with a curriculum-first approach to trading education. One good syllabus, taught in the order that makes you better.