Forex Indicators: A Beginner's Guide to FX Trading Tools
Learn how forex indicators track trends, momentum, and volatility to build clean trading setups. Read the full guide.
By Trader Faculty Team
Direct Answer
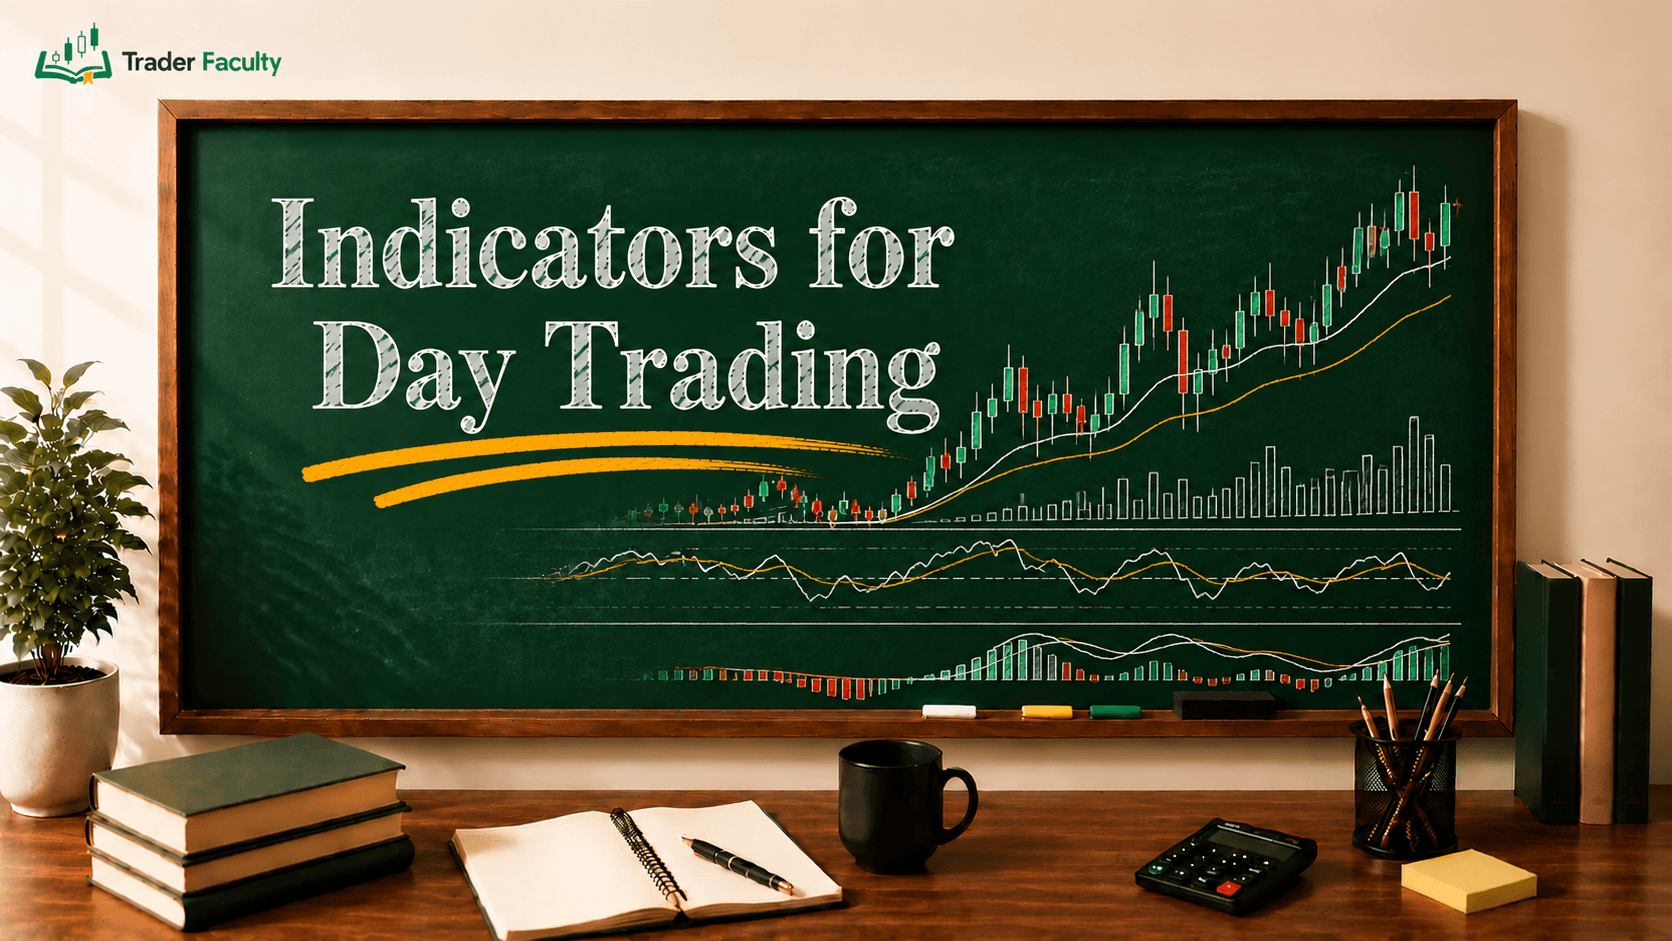
Forex indicators are mathematical tools that process historical price action and tick frequency to help traders identify market trends, momentum speed, and price volatility. They transform past price data into visual overlays and sub-window oscillators to highlight recurring currency market patterns.
Forex indicators are mathematical tools that process historical exchange rates and price change frequency to help traders identify trends, price momentum, and market volatility. They turn raw chart data into visual lines and bands that show how prices moved in the past.
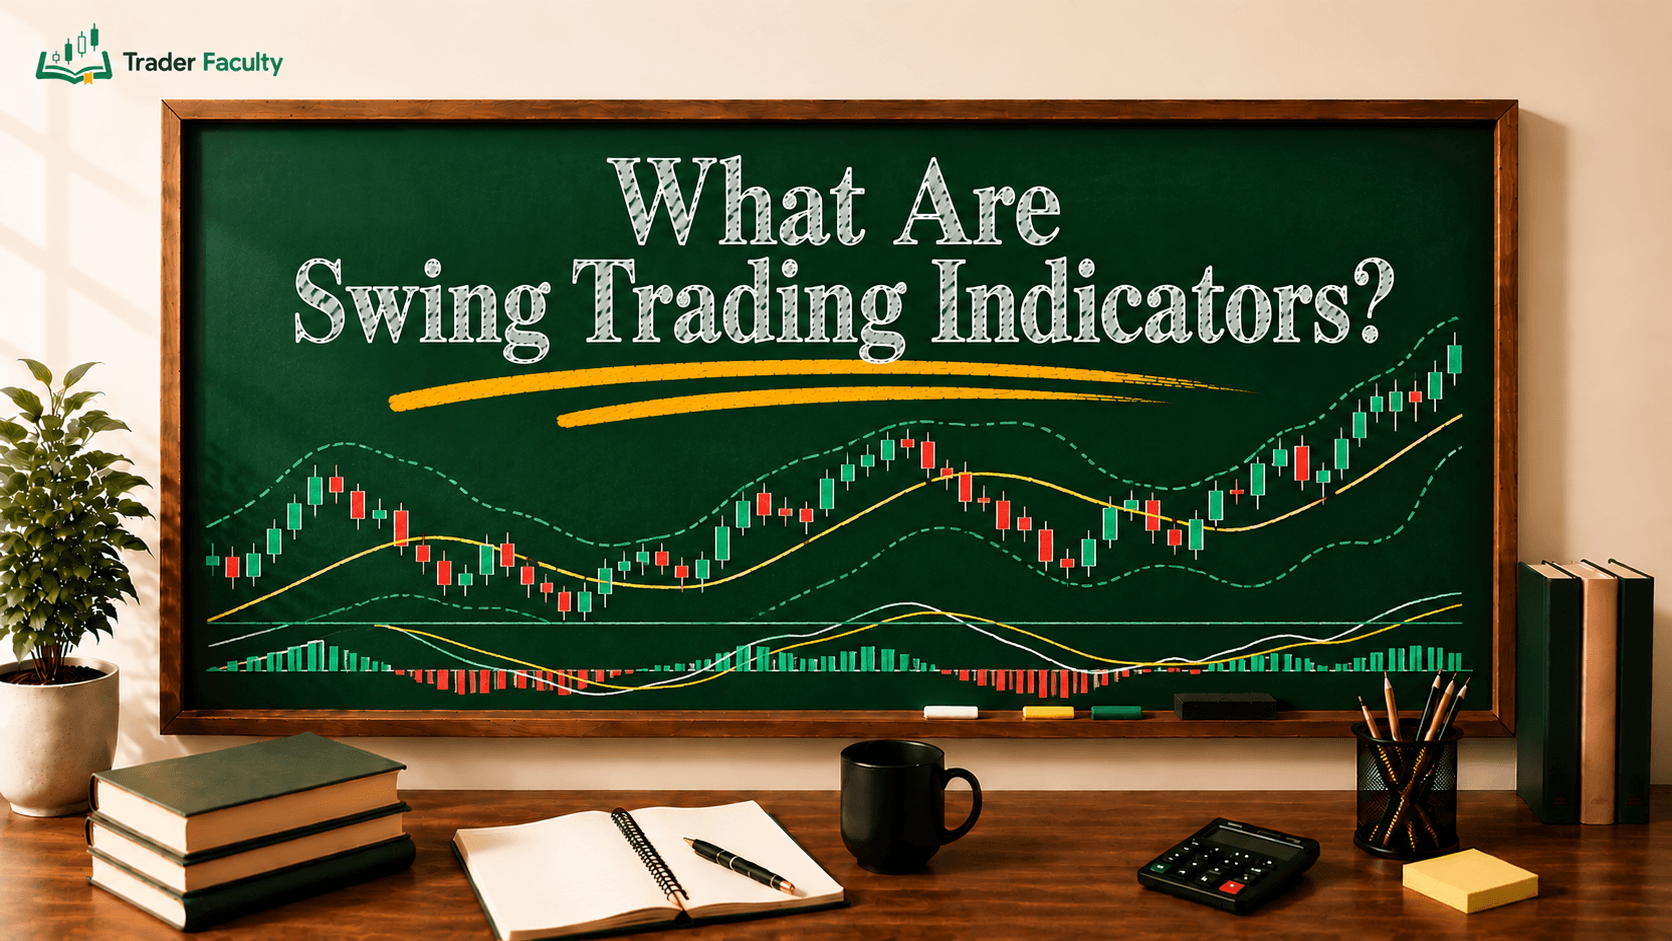
Many new traders clutter their charts with too many tools, creating conflicting signals that cause confusion during fast market movements. This guide covers the four main indicator categories, how tick volume works in spot currency trading, how to build a simple indicator setup, and how to avoid standard technical analysis traps.
Quick Takeaways
- Technical indicators transform past price action into visual lines to highlight trend direction, momentum speed, and volatility.
- Spot forex volume is measured using tick frequency rather than centralized exchange transaction volume.
- Combining non-correlated tools—such as one trend line, one momentum oscillator, and one volatility band—prevents chart clutter.
- Indicators lag price action and cannot predict sudden market changes driven by economic news events.
What Are Forex Indicators?
Forex indicators are visual calculations applied to price charts to help traders spot recurring market patterns. They run mathematical formulas on open, high, low, and close prices across selected timeframes, converting raw price action into clean visual trends.
Traders divide these tools into two technical formats: chart overlays and sub-window oscillators. Overlays sit directly on top of price candles, acting as dynamic boundaries for trend direction. Moving averages and channel lines are common examples. Sub-window oscillators appear in a separate box below the main chart, tracking market speed and relative price changes between upper and lower boundaries.
No technical tool predicts future currency movements with total accuracy. Indicators merely summarize past price action to show whether current price movement is standard or unusual relative to past history.
The Four Core Categories of FX Indicators

Selecting the best forex indicators requires understanding how different mathematical calculations serve distinct analytical jobs. Grouping indicators by function prevents traders from relying on duplicate data.
1. Trend-Following Tools
Trend indicators help traders identify the main direction of exchange rate movement and filter out random price noise. The Simple Moving Average (SMA) calculates average price over a chosen set of candles, while the Exponential Moving Average (EMA) applies greater weight to recent price changes. When price sits above a rising moving average, the market displays upward momentum. When price stays below a falling moving average, the market displays downward bias.
2. Momentum Oscillators
Momentum tools measure how fast prices change over a specific period. The Relative Strength Index (RSI) moves on a scale from 0 to 100 to show whether price has moved too far in one direction relative to recent sessions. Moving Average Convergence Divergence (MACD) tracks two moving averages to show shifting momentum strength. When momentum fails to confirm price peaks, traders look for RSI divergence as a sign that the current move may be losing energy.
3. Volatility Indicators
Volatility tools measure the spread and dispersion of price swings around an average value. The Average True Range (ATR) calculates the average distance between high and low prices across recent periods, providing traders with an objective measure for setting stop-loss distances. Bollinger Bands expand during volatile periods and contract during quiet consolidation, showing when price moves outside its standard deviation limits.
4. Tick Volume Tools
Volume calculation in foreign exchange works differently from centralized stock markets. The CFTC warns traders that spot currency markets operate without a single central clearinghouse, which directly changes how trading volume is recorded. Forex platforms use tick volume, which measures how many times price updates within a specific time unit, rather than total contracts traded. High tick volume shows active market participation, while low tick volume points to slow liquidity.
Leading vs. Lagging Indicators: Matching Tools to Market Regimes
Lagging indicators confirm established trends after price movement starts. Moving averages are typical lagging tools because they require past candles to update their current value. A 200-period average confirms a long-term direction, but it gives entry signals well after a major turn begins. The trade-off is higher signal reliability during sustained trends.
Leading indicators attempt to signal potential price shifts before they appear in overall market direction. Oscillators like RSI or Stochastics aim to highlight momentum limits near extreme highs or lows. While leading tools offer early entries, they carry a high risk of false signals during strong directional trends where price stays near boundaries for long periods.
Matching indicator selection to market conditions is essential for technical analysis:
- Trending Regimes: Moving averages and trend lines help traders stay aligned with market flow. Momentum oscillators often fail here by generating false counter-trend signals.
- Range-Bound Regimes: Oscillators excel when price bounces between horizontal support and resistance lines. Trend-following indicators fail here, producing frequent losing trades due to whipsaws.
How to Combine Indicators Without Chart Clutter
The most effective technical setups follow the rule of synergy: combine 2–3 non-correlated tools that cover different functional categories. Using top forex indicators together works only when each tool performs a unique job.
| Category | Function | Examples |
|---|---|---|
| Trend | Tracks directional price flow | Moving Averages (SMA/EMA) |
| Momentum | Measures speed of price changes | RSI, MACD |
| Volatility | Measures price dispersion and range | ATR, Bollinger Bands |
| Tick Volume | Tracks frequency of price updates | FX Tick Volume |
Avoid stacking tools from the same family, such as placing RSI, Stochastic, and Williams %R on the same chart. Because these tools process similar mathematical relationships, they display duplicate signals at identical times, creating false confidence rather than real confirmation.
Traders do not need expensive software packages to analyze currency charts. Most charting platforms include reliable, free forex indicators as built-in defaults, offering all necessary mathematical tools out of the box.
Common Pitfalls When Trading With Forex Indicators
- Treating Calculations as Predictions: Technical tools summarize historical price data. Assuming an indicator guarantees a specific future price path leads to poor risk decisions.
- Ignoring Scheduled Economic News: Central bank interest rate decisions, employment figures, and inflation releases create sudden volatility spikes that override technical indicator setups instantly.
- Over-Relying on Overbought and Oversold Levels: During strong trends, momentum oscillators can remain above 70 or below 30 for days. Selling simply because RSI reaches 70 in a strong uptrend is a common beginner mistake.
- Changing Parameters Too Frequently: Constantly adjusting inputs to fit past price charts creates curve-fitted strategies that fail in live trading conditions.
Conclusion
Forex indicators help traders analyze historical price trends, assess price speed, and measure market volatility in an objective visual format. By selecting one tool from distinct functional categories, you keep your charts clean and avoid duplicate signal noise. Remember that indicators reflect past price action and perform best when paired with strict risk management rules. To build a complete market framework, explore our overview on technical indicators to see how these tools work alongside price action. Trading always carries the risk of losing capital, so treat every technical tool as an educational starting point rather than a financial guarantee.
Frequently Asked Questions
What are the best indicators for forex trading?
The best forex indicators depend on the market regime. In trending markets, moving averages help identify directional bias. In range-bound markets, oscillators like the Relative Strength Index (RSI) track momentum shifts near dynamic boundaries. Combining non-correlated tools creates a balanced analytical framework.
What are the 4 main types of technical indicators in forex?
The four core categories are trend-following indicators (such as Moving Averages), momentum oscillators (such as RSI and MACD), volatility indicators (such as Average True Range and Bollinger Bands), and tick volume tools (which track price update frequency in spot forex).
Are forex indicators leading or lagging?
Forex indicators are either leading or lagging based on their mathematical construction. Lagging indicators, like moving averages, follow past price movements to confirm established trends. Leading indicators, like momentum oscillators, measure price velocity to highlight potential market inflection points before price turns.
How does volume work in forex indicators?
Unlike centralized stock exchanges, spot forex operates as a decentralized market without a central clearinghouse. Consequently, forex volume indicators measure tick volume—the frequency of price updates within a given timeframe—rather than total traded contracts or dollar volume.
How many technical indicators should you use on a chart?
Most traders achieve the best clarity by using two to three non-correlated indicators. Stacking tools from different functional families—such as one trend-following moving average, one momentum oscillator, and one volatility indicator—prevents signal redundancy and avoids chart clutter.
Keep learning
TA Masterclass
Reading charts one article at a time? Get the full method, in order.
10 lessons quiz
Start TA MasterclassThe Trader Faculty Team writes and reviews every guide together — pairing hands-on market experience with a curriculum-first approach to trading education. One good syllabus, taught in the order that makes you better.