What Are Technical Indicators? A Complete Guide for Traders
Learn what technical indicators are, how they process price and volume data, and how to build a clean chart. Read the full guide.
By Trader Faculty Team
Direct Answer
Technical indicators are mathematical calculations based on historical price, volume, or open interest used by traders to analyze market conditions. They process raw chart data into visual overlays and sub-pane oscillators to identify trends, momentum, volatility, and market flow without predicting future price action.
A technical indicator is a mathematical calculation based on historical price, volume, or open interest — that is, the number of active derivative contracts held by market participants — used by traders to evaluate market conditions.
Many new traders add dozens of tools to their charts hoping to spot perfect trade entries, only to end up confused by conflicting signals. Understanding how technical indicators function helps you build a clean, balanced chart layout. This guide breaks down the main indicator categories, explains how they process market data, and shows how to combine them without cluttering your view.
Quick Takeaways
- Technical indicators transform past price and volume data into visual tools to help traders identify trends, momentum, and price volatility.
- Overlay indicators sit directly on top of price charts, while sub-pane oscillators operate in a separate window below price action.
- Combining tools from different functional categories prevents signal redundancy and reduces chart clutter.
- Indicators confirm market conditions using past data; they do not predict future market movements.
How Technical Indicators Work: Calculations and Classifications
Technical indicators work by taking raw price data — open, high, low, close, and volume — and passing it through mathematical formulas. These calculations turn noisy, tick-by-tick price changes into smooth lines, histograms, or dynamic boundaries. According to educational standards set by the CFA Institute, technical analysis relies on processing historical market data to evaluate price patterns rather than assessing intrinsic business value.
To use indicators effectively, you need to understand how they appear on your screen and when their calculations update.
Overlays vs. Sub-Pane Oscillators
Indicators display on trading charts in two distinct locations:
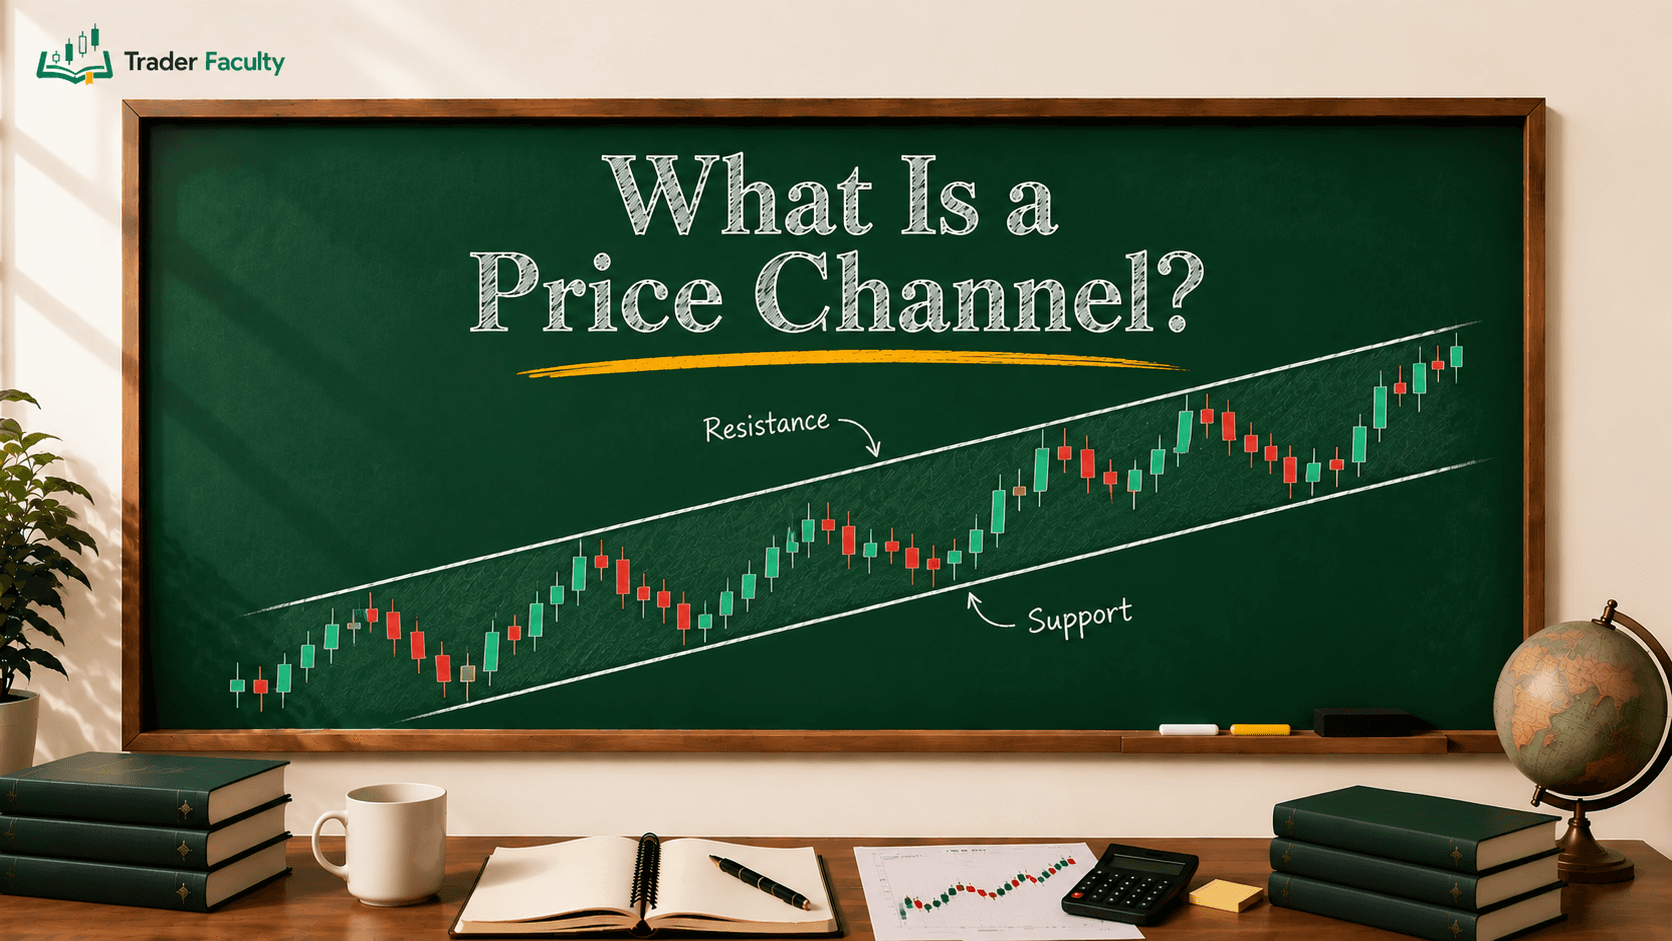
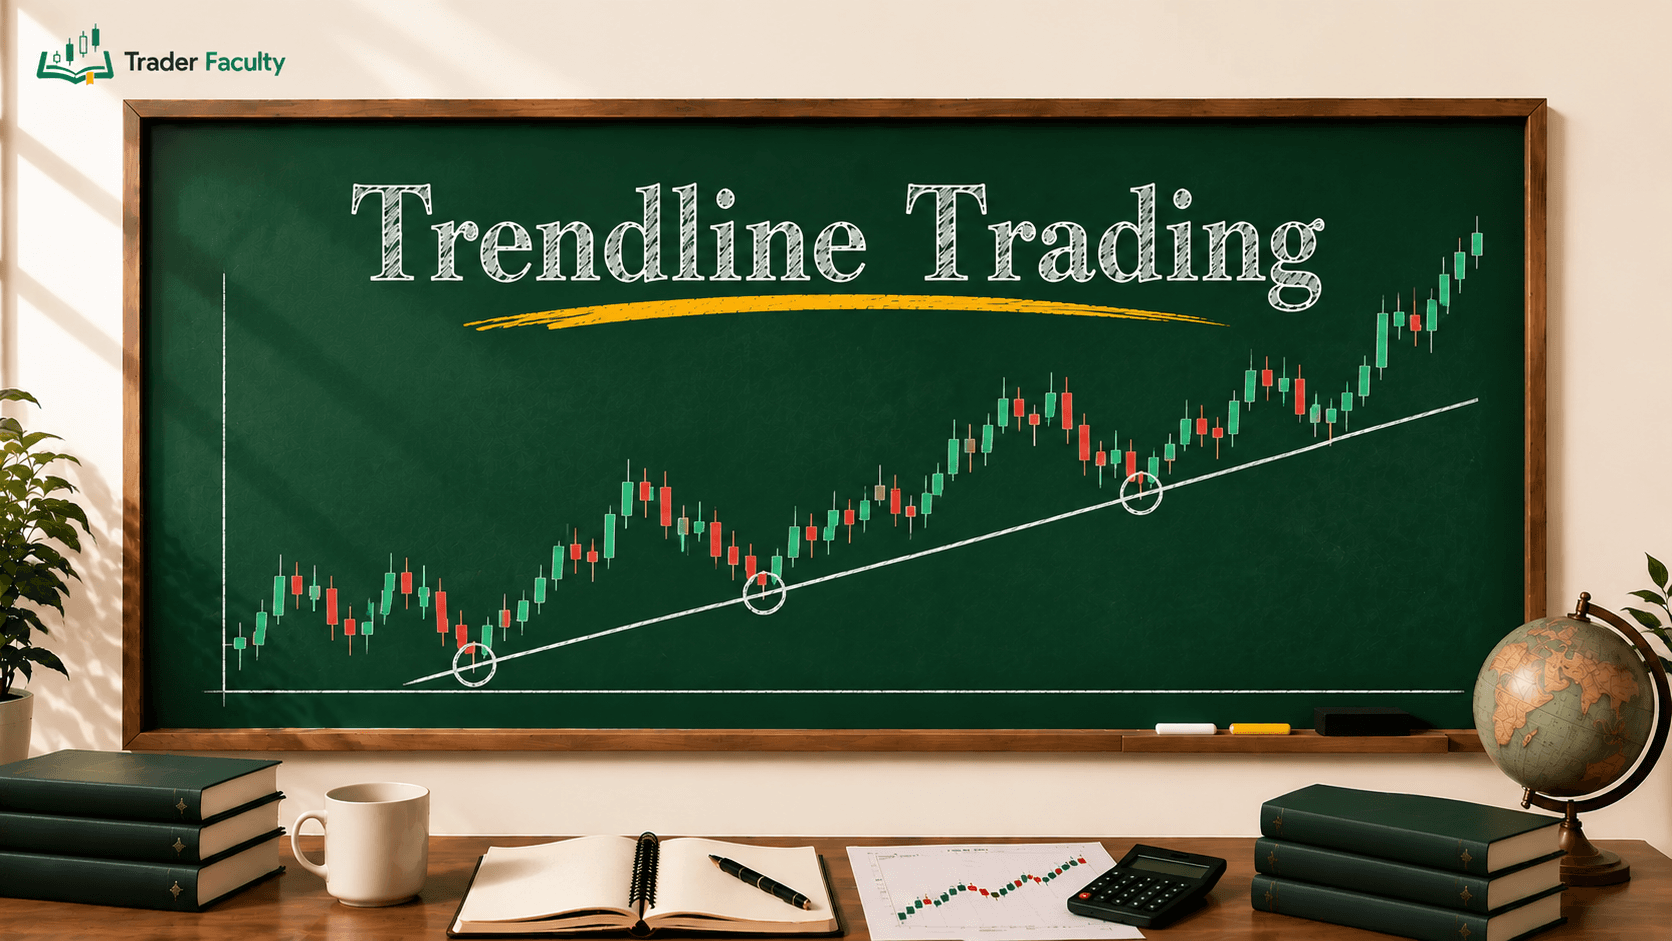
- Overlays: These tools share the same scale as price action and are drawn directly on top of price candles. Examples include trend lines, price channels, and moving averages. Overlays help you compare current market prices directly against averaged historical price levels.
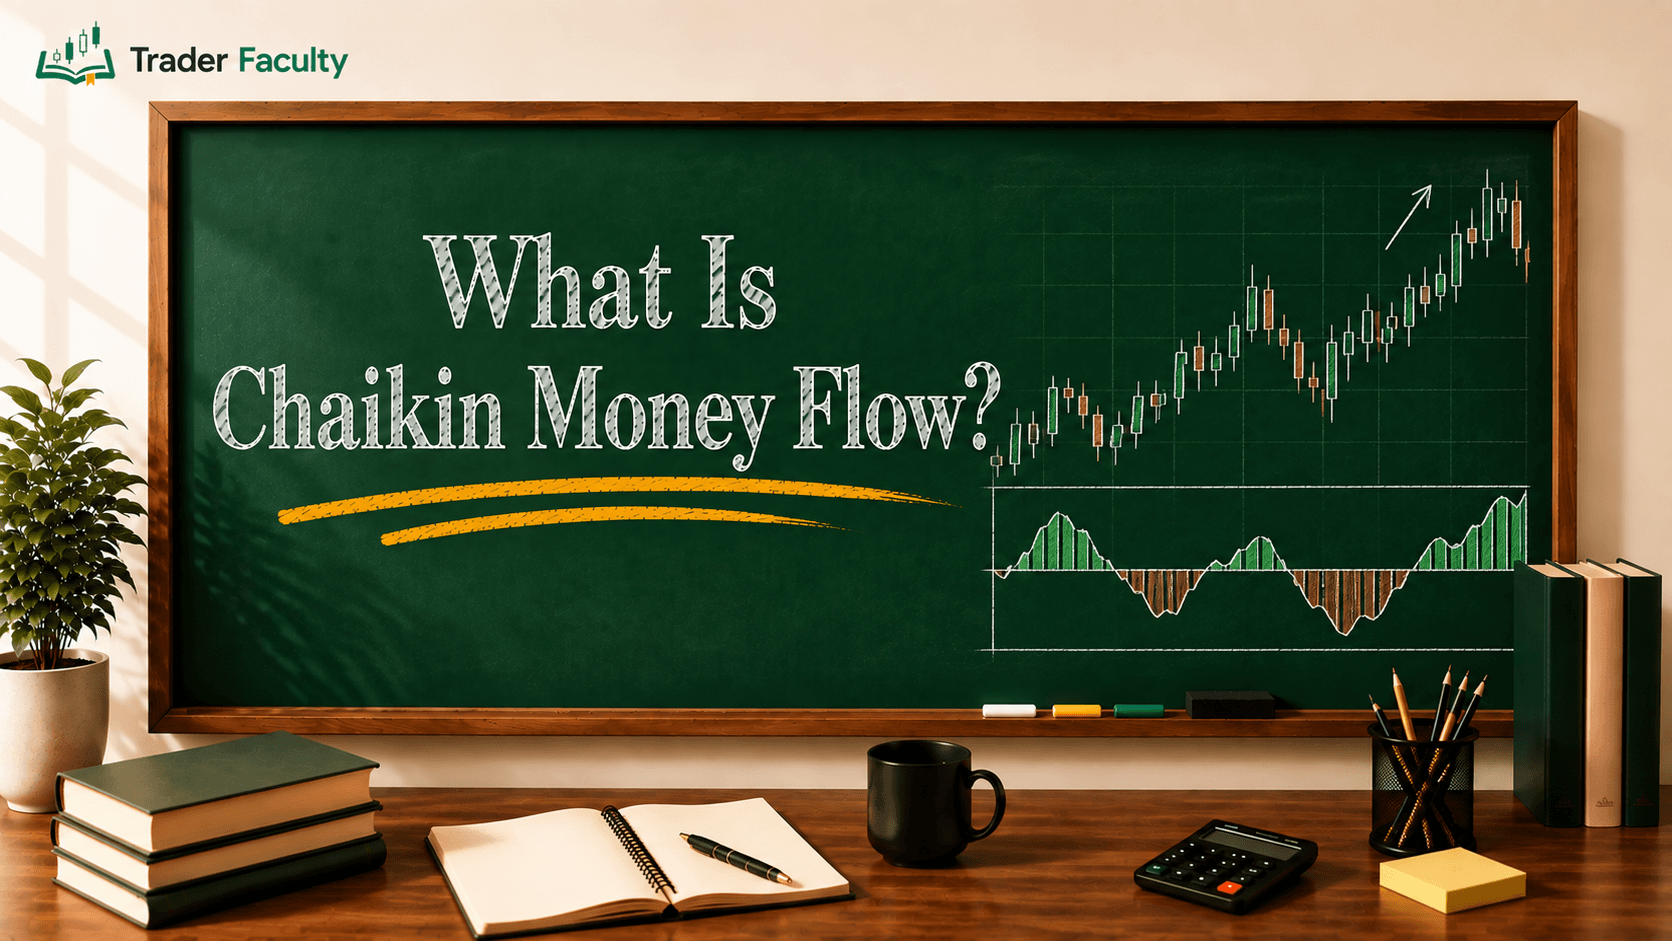
- Sub-Pane Oscillators: These indicators sit in a secondary window directly below the primary price chart. Oscillators move back and forth within a set range or around a central zero line. They measure how fast prices move or identify overbought levels — market states where price has risen unusually fast and may slow down.
Lagging vs. Leading Indicators
Indicators also differ in how quickly they react to price shifts:
- Lagging Indicators: These tools use historical averages to confirm existing trends. Because they require past price history to calculate values, they react after a price move has already started. While lagging tools give fewer false signals, they offer entry points later in a trend.
- Leading Indicators: These tools measure price speed and momentum over short timeframes. They aim to signal potential price shifts before they fully develop on the chart. However, because they react rapidly to quick price movements, leading tools can generate false signals in choppy market conditions.
Trend-Following Indicators: Identifying Market Direction
Trend indicators help traders determine the primary direction of a market. In a fast-moving market, price action contains noise — temporary pullbacks and sharp spikes that distract from the main move. Trend tools smooth out these temporary price fluctuations so you can see whether buyers or sellers remain in control.
These tools are lagging by design. They do not aim to catch the exact bottom or top of a price move. Instead, their job is to confirm that a sustained trend is underway and show when that trend begins to lose direction.
Filtering Price Noise with Averages
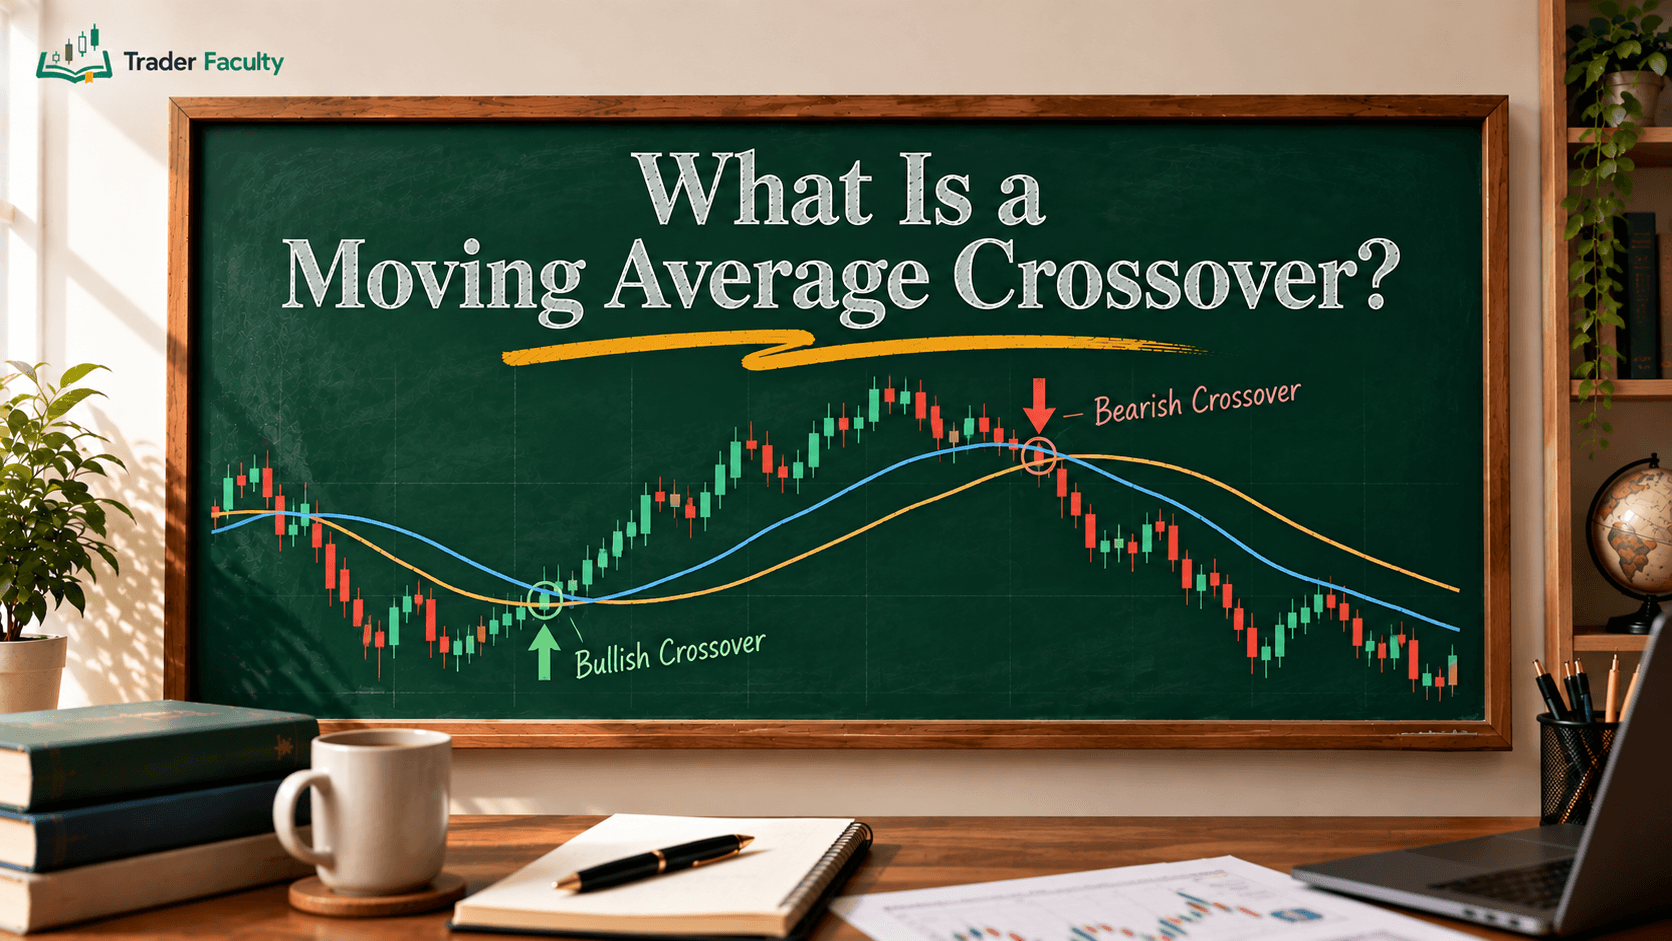
The most common way to measure market direction is with a moving average. By calculating the average price of an asset over a set number of historical periods, this tool creates a smooth line that follows price action. When price sits above a rising average line, the broader trend favors buyers. When price remains below a falling average line, the market trends downward.
Traders often use shorter averages to track quick price shifts and longer averages to identify multi-month market direction.
Measuring Trend Strength
Knowing the direction of a market is only half the battle; you also need to know if the trend has enough strength to continue. The Average Directional Index (ADX indicator) measures the intensity of a trend regardless of whether price moves up or down.
By tracking trend strength on a scale, this tool helps traders avoid entering weak trends that are prone to sudden reversals.
Momentum Oscillators: Measuring Price Speed and Reversals
While trend tools track market direction, momentum oscillators measure the speed and acceleration of price changes. Think of momentum like throwing a ball into the air: before the ball falls back down, its upward speed slows down. Momentum oscillators help traders detect that deceleration before price actually turns around.
Oscillators usually operate in a sub-pane below the main chart, helping you identify when price moves too far, too fast.
Identifying Overbought and Oversold Zones
When buyers push prices up aggressively without a break, the market reaches an overbought state. Conversely, aggressive selling can push prices down into an oversold zone.
The Relative Strength Index (RSI) oscillator measures the speed of recent price changes on a scale from 0 to 100. When the line reaches extreme upper or lower bounds, it alerts traders that momentum is stretching thin and a short-term pullback or pause may follow.
Tracking Momentum Shifts and Divergences
Momentum often changes before price changes. A tool like the Moving Average Convergence Divergence (MACD) tracks the relationship between two moving averages to show changes in market momentum.
When momentum moves in the opposite direction of price — a condition known as divergence — it alerts traders that the current trend is losing power. For instance, if price makes a new high but the momentum tool makes a lower high, buyers may be tiring.
Volatility Indicators: Tracking Range Expansion and Contraction

Market volatility is not constant. Financial markets cycle through predictable phases: periods of quiet price consolidation lead to sudden explosions of volatility, and high-volatility moves eventually settle back into quiet ranges.
Volatility indicators measure the size and speed of price swings. They do not tell you which direction price will travel; instead, they show how wide price is swinging relative to historical norms.
Measuring Absolute Price Ranges
To manage risk properly, traders need to know how far an asset typically moves during a single trading session. The Average True Range (ATR) indicator calculates the average price range between market highs and lows over a set period.
Knowing an asset's normal price movement helps traders place realistic stop-loss orders. Setting a stop-loss distance smaller than the daily average volatility often causes a trade to close prematurely due to standard market noise.
Dynamic Volatility Bands
Other volatility tools place dynamic upper and lower bands around price action. During quiet market phases, these bands contract tightly around price. When news hits or buying pressure surges, the bands expand outward to accommodate the wider price range. Traders watch these expansion and contraction cycles to prepare for breakout opportunities.
Volume and Market Flow Indicators: Validating Price Movement
Price action shows what market participants are doing, but volume shows how much conviction sits behind those actions. Volume measures the total number of shares, contracts, or units traded during a specific time period.
An upward price move supported by high volume indicates strong institutional participation. Conversely, a price breakout occurring on light volume suggests a lack of buyer interest, making the move vulnerable to a quick failure.
Confirming Price Moves with Trading Volume
Analyzing raw trading volume provides a reality check for chart patterns. When price breaks above a key resistance level, traders look for a simultaneous spike in volume to confirm that buyers are actively committing capital. Without volume confirmation, price breakouts often turn out to be false signals.
Institutional Benchmark Tools
Intraday traders rely on specialized volume tools to track where large institutional trades take place. The Volume-Weighted Average Price (VWAP) calculates the average price an asset has traded at throughout the day, weighted by total volume at each price level.
Because institutional orders are large, institutional traders use this benchmark line to gauge whether they are buying or selling at fair value compared to the rest of the market.
Structural & Measurement Tools: Price Action Frameworks
Technical indicators give valuable mathematical data, but they work best when combined with structural chart frameworks. Price structure refers to key support levels, historical turning points, and candlestick formations created directly by buyer and seller behavior.
Using indicators alongside structural tools helps traders ground mathematical values in real market price action.
Reading Raw Price Action
Before applying mathematical tools, traders study price charts directly to understand current market sentiment. Learning to read candlestick charts reveals who held control during a specific trading session — buyers, sellers, or neither. Individual candle shapes and multi-candle patterns show market turning points in real time.
Measuring Retracement Levels
Markets rarely move in a straight line. During an uptrend, price regularly pulls back to retest previous levels before resuming its path upward.
Traders use Fibonacci retracement levels to identify prospective support and resistance zones during these pullbacks. Measuring the ratio of a past price move gives you specific visual levels where price is likely to pause.
How Technical Indicators Connect: Building a Balanced System
The most common mistake new traders make is adding too many indicators to a single chart — a mistake known as analysis paralysis. Stacking three different momentum oscillators at the bottom of your screen does not give you three distinct pieces of evidence; it gives you the same momentum signal three times.
To build a balanced charting setup, select one tool from each major category:
| Category | Primary Job | Sample Tool Focus |
|---|---|---|
| Trend | Identifies market direction | Smooths price noise over time |
| Momentum | Measures price speed | Identifies overbought/oversold conditions |
| Volatility | Tracks range expansion | Informs stop-loss and risk sizing |
| Volume | Validates conviction | Confirms institutional participation |
Adjusting for Market Regimes
Indicators perform differently depending on overall market conditions:
- Trending Markets: Trend-following tools like moving averages work well when price moves steadily in one direction. However, momentum oscillators tend to stay in extreme overbought or oversold territory for long periods during strong trends, giving early reversal signals that fail.
- Ranging Markets: In sideways or ranging markets, momentum oscillators excel at identifying buy and sell zones near support and resistance. Conversely, trend indicators perform poorly in sideways markets, generating frequent whipsaws as price moves back and forth across average lines.
Conclusion
Technical indicators transform past price, volume, and open interest data into visual tools that help traders evaluate market conditions. By classifying indicators into clear functional roles — trend, momentum, volatility, volume, and structure — you can select a balanced set of tools that complement each other rather than clutter your screen.
As you build your chart layout, keep these practical guidelines in mind:
- Use trend indicators to confirm directional bias and volatility tools to size risk correctly.
- Avoid redundant indicators by picking only one primary tool per functional category.
- Remember that technical indicators are analytical aids designed to evaluate past price action; they do not predict market movements or remove trading risk.
To deepen your understanding of chart analysis and risk management, explore our foundational guides on technical analysis.
Frequently Asked Questions
What are technical indicators?
Technical indicators are mathematical formulas applied to historical market data—such as open, high, low, close prices, and volume. Traders use them to filter out short-term price noise, measure trend direction, evaluate momentum, and analyze volatility across various financial assets.
What are the four main types of technical indicators?
The four primary functional categories of technical indicators are trend-following indicators (like moving averages), momentum oscillators (such as RSI and MACD), volatility indicators (like ATR), and volume indicators (such as VWAP and trading volume).
What is the difference between an overlay and an oscillator?
An overlay is plotted directly over the main price chart alongside price candles, such as moving averages. An oscillator is rendered in a separate sub-window beneath the main chart, oscillating between set numerical boundaries or around a central baseline to measure price speed or range.
Can technical indicators predict future market movements?
No, technical indicators don't predict the future. They are calculated entirely from past price and volume data. Their main role is to help traders summarize historical market behavior, evaluate current conditions, and systematically manage risk rather than forecast exact price outcomes.
How many technical indicators should a beginner use?
Beginners should keep chart layouts simple by using no more than two or three indicators from distinct functional categories—such as one overlay for trend direction and one sub-pane tool for momentum. Stacking multiple indicators of the same category causes signal clutter and analysis paralysis.
The Trader Faculty Team writes and reviews every guide together — pairing hands-on market experience with a curriculum-first approach to trading education. One good syllabus, taught in the order that makes you better.