What Are Bollinger Bands? How Volatility Bands Work
Learn how Bollinger Bands measure market volatility using moving averages and standard deviations. Read the full guide.
By Trader Faculty Team
Direct Answer
Bollinger Bands are a technical analysis indicator consisting of a middle simple moving average and two outer bands set two standard deviations away. They dynamically expand during high market volatility and contract during low volatility, helping traders gauge potential price extremes without offering guaranteed reversal signals.
Bollinger Bands are a technical analysis indicator consisting of a middle simple moving average and two outer bands set two standard deviations away. They dynamically expand and contract to measure market volatility and help traders identify potential price extremes.
Many new traders assume that when a price touches an outer band, it means the market is about to reverse. However, prices often continue pushing along these boundaries during strong market trends.
This guide breaks down how Bollinger Bands work, how to calculate them, how to spot volatility squeezes, and the common pitfalls to avoid.
Quick Takeaways
- Bollinger Bands use a middle moving average and two outer bands calculated via standard deviations to visualize market volatility.
- Band expansion signals high market volatility, while a band squeeze highlights low volatility that often precedes strong price breakouts.
- A price touching or breaching the outer bands indicates strong momentum or extreme volatility, not an automatic buy or sell signal.
- Combining Bollinger Bands with momentum indicators like RSI helps confirm market conditions and reduce false signals.
What Are Bollinger Bands?
Bollinger Bands are a popular tool in technical analysis created by John Bollinger in the early 1980s to capture dynamic volatility. Unlike fixed trading channels or standard support and resistance levels, Bollinger Bands widen and narrow automatically as price fluctuations increase or decrease.
The indicator consists of three distinct lines overlaid directly onto a price chart:
- Middle Band: A baseline moving average reflecting the intermediate price trend.
- Upper Band: A line positioned above the middle band at a set distance determined by price volatility.
- Lower Band: A line positioned below the middle band at an identical set distance.
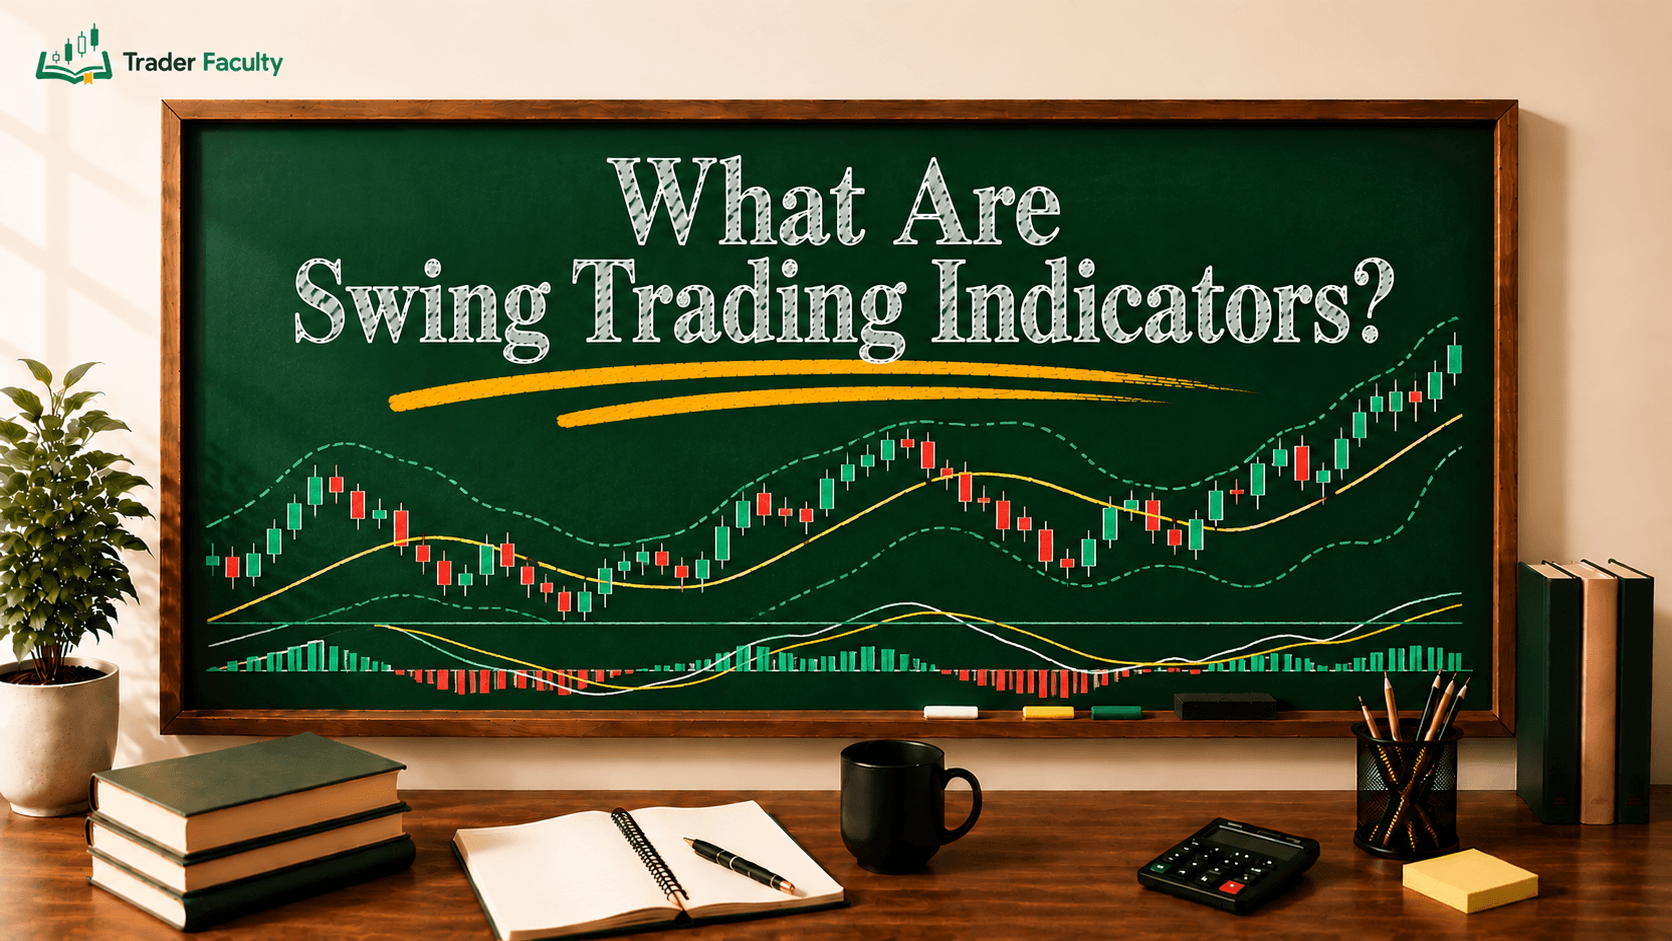
When price movement becomes fast and unpredictable, the outer bands expand away from the center line. When the market calms into a period of quiet consolidation, the outer bands pull tightly together.
How Bollinger Bands Work: Calculation and Mechanics
Understanding how Bollinger Bands function requires looking at their three underlying components. On most modern trading platforms, the indicator uses standard default parameters:

Standard deviation is a statistical concept that measures dispersion—how spread out price data is relative to its average.
In simple terms, standard deviation tracks variance:
- High Volatility: When prices move sharply up or down, standard deviation rises. The formula adds and subtracts a larger value from the 20-period average, pushing the upper and lower bands apart.
- Low Volatility: When prices move sideways in a tight range, standard deviation drops. The formula adds and subtracts a smaller value, drawing the bands close together.
Because two standard deviations statistically cover roughly 95% of historical price action under a normal distribution model, price movements outside the bands are relatively rare and highlight periods of significant momentum. Platform defaults typical set this to a 20-period lookback with 2 standard deviations.
How Traders Use Bollinger Bands in Real Markets
Trader monitor how price interacts with the outer boundaries to gauge shifting market regimes.
The Volatility Squeeze Setup
A Bollinger Band squeeze occurs when the upper and lower bands contract to an unusually tight distance. This visual pattern indicates a low-volatility period. Because extended periods of quiet market activity are frequently followed by sharp directional moves, traders watch for a squeeze to prepare for upcoming price breakouts.
Walking the Bands
During powerful long-term trends, price action often touches or continuously clings to an outer boundary. In a strong uptrend, prices frequently ride along the upper band; in a strong downtrend, they press along the lower band. This behavior is known as "walking the bands" and signals sustained directional momentum rather than an immediate turning point.
Range Trading Boundaries
In sideways markets with no clear overall trend, the upper and lower bands can serve as temporary dynamic boundaries. Traders often look for buying opportunities when price stabilizes near the lower band, or selling opportunities when price approaches the upper band, provided overall market context confirms a ranging environment.
Common Bollinger Band Traps to Avoid
Relying on Bollinger Bands without proper context can quickly lead to costly trading mistakes.
Trap 1: Treating Outer Bands as Automatic Reversal Signals
The most frequent mistake is assuming that an upper band touch means a market is "overbought" and must fall, or that a lower band touch means it is "oversold" and must rise. Touching an outer band simply indicates that current price action is statistically far from its recent 20-period average—it does not guarantee a reversal.
Trap 2: Ignoring Market Context
Using mean-reversion tactics during strong trending environments leads to repeated losses. Attempting to short a stock touching its upper band while a major news event or powerful breakout trend is underway ignores macro market momentum.
Trap 3: Using Bollinger Bands in Isolation
No single technical tool provides complete information. Relying strictly on Bollinger Bands without looking at overall trend structure, chart patterns, or confirming indicators leaves traders vulnerable to unexpected price spikes.
Combining Bollinger Bands with Other Technical Indicators
To filter out false signals, traders combine Bollinger Bands with complementary analysis tools.
| Indicator Pairing | Primary Function | Confirmation Role |
|---|---|---|
| Relative Strength Index | Momentum & Divergence | Spotting momentum loss near bands |
| Stochastic Oscillator | Overbought/Oversold Oscillations | Timing entries in range markets |
| Trading Volume | Market Participation | Validating squeeze breakouts |
Pairing the bands with momentum tools like the stochastic oscillator helps confirm entry signals during range-bound conditions. For example, if price reaches the upper Bollinger Band while a momentum oscillator displays a bearish divergence, the likelihood of a pullback increases compared to reading the band touch alone.
Volume indicators also play a vital role during breakout setups. A volatility squeeze accompanied by expanding trading volume suggests institutional interest and supports the sustainability of the breakout.
Conclusion
Bollinger Bands serve as an intuitive visual gauge for market volatility, dynamic support and resistance zones, and potential squeeze breakouts. By framing price relative to its standard deviation, this indicator helps contextualize market movements within a statistical baseline.
However, outer band touches should never be treated as direct buy or sell execution triggers. Successful application relies on combining volatility bands with trend analysis, oscillator confirmation, and sound risk management practices. Trading financial markets involves a continuous risk of loss, so test your strategy thoroughly on historical price data before placing live capital.
To deepen your understanding of technical indicators and chart patterns, explore the comprehensive lessons in our technical indicators hub.
Frequently Asked Questions
What is a Bollinger Band squeeze?
A Bollinger Band squeeze occurs when the upper and lower bands contract tightly together, reflecting a period of unusually low market volatility. Because periods of low volatility are historically followed by strong directional moves, traders monitor squeezes to prepare for potential price breakouts.
Does touching the upper Bollinger Band mean you should sell?
No, touching the upper Bollinger Band is not an automatic sell signal. In strong uptrends, price action can continuously push along or "walk" the upper band as upward momentum persists. Traders look for confirming indicators before anticipating a market reversal.
What are the standard default settings for Bollinger Bands?
The standard default settings for Bollinger Bands are a 20-period Simple Moving Average (SMA) for the middle band, with the upper and lower bands set two standard deviations above and below that average. These settings can be adjusted depending on the asset class and trading timeframe.
Are Bollinger Bands a leading or lagging indicator?
Bollinger Bands are primarily a lagging indicator because they rely on a 20-period historical simple moving average and past price variance. While they visually expand and contract in real time, their calculations reflect historical price data rather than predicting future direction.
Which technical indicators pair best with Bollinger Bands?
Momentum oscillators like the Relative Strength Index (RSI) or Stochastic Oscillator complement Bollinger Bands well. Pairing bands with volume indicators also helps confirm whether a price breakout from a squeeze setup is supported by active market participation.
Keep learning
TA Masterclass
Reading charts one article at a time? Get the full method, in order.
10 lessons quiz
Start TA MasterclassThe Trader Faculty Team writes and reviews every guide together — pairing hands-on market experience with a curriculum-first approach to trading education. One good syllabus, taught in the order that makes you better.