What Is the ADX Indicator? How to Measure Trend Strength
Discover how the ADX indicator measures market trend strength without bias. Read the full guide.
By Trader Faculty Team
Direct Answer
The Average Directional Index (ADX) is a technical indicator used to measure the overall strength of a price trend on a scale from 0 to 100. Because it is non-directional, a rising ADX value indicates a strengthening trend regardless of whether price is moving up or down. Traders pair ADX with directional movement lines (+DI and -DI) to identify when to trade momentum setups or avoid choppy, sideways markets.
The Average Directional Index (ADX) is a non-directional technical indicator that measures the strength of a price trend on a scale from 0 to 100, without specifying whether the trend is bullish or bearish.
Many novice traders mistakenly buy an asset simply because its ADX line is climbing, only to realize the asset is actually in a steep freefall. Understanding how ADX evaluates momentum helps you avoid trading in flat, directionless markets.
This guide breaks down how the ADX works, how to read its key levels, and how to combine it with other tools effectively.
Quick Takeaways
- ADX measures how strong a market trend is, but it does not tell you whether price is moving up or down.
- Readings below 20 signal a weak or sideways market, while readings above 25 indicate a strong trend worth following.
- ADX works as part of a three-line system alongside the Positive Directional Indicator (+DI) and Negative Directional Indicator (-DI).
- Combining ADX with moving averages or oscillators helps traders filter out bad signals during market consolidation.
What Is the ADX Indicator?
Many beginners ask "what is the ADX indicator" because it looks similar to other oscillators, but its non-directional nature makes it fundamentally different.
Developed by J. Welles Wilder Jr. in his 1978 book New Concepts in Technical Trading Systems, the Average Directional Index (ADX) was designed to solve a fundamental trading challenge: identifying whether a market is trending or simply moving sideways.
Unlike classic momentum oscillators, the ADX is completely non-directional. When an asset's price trends aggressively downward during a market panic, the ADX line rises. When an asset rallies powerfully toward new all-time highs, the ADX line also rises. In both cases, the indicator is confirming the presence of strong directional conviction.
To visualize this concept, think of the ADX like a car’s speedometer. The speedometer indicates how fast the vehicle is traveling—whether it is moving at 20 mph or 80 mph—but it cannot tell you if the car is driving forward or in reverse. The ADX measures the speed or power of price movement, requiring separate directional cues to determine where the asset is headed.
The Mechanics Behind ADX: Understanding the DMI Indicator System
To get the full picture, you must understand that ADX rarely works in isolation. It forms the core component of the broader DMI indicator (Directional Movement Index) framework, which consists of three distinct lines plotted on a single sub-chart:
- Positive Directional Indicator (+DI): Tracks upward price expansion by comparing current high prices against previous high prices.
- Negative Directional Indicator (-DI): Tracks downward price expansion by comparing current low prices against previous low prices.
- Average Directional Index (ADX): A smoothed moving average that calculates the absolute difference between +DI and -DI, converted onto a 0-to-100 scale.
When +DI sits above -DI, buyers are in control of the market's direction. Conversely, when -DI sits above +DI, sellers hold the upper hand. The ADX line then gauges the intensity of whichever group is winning.
If +DI is well above -DI and ADX is rising, you have a strong uptrend. If -DI is well above +DI and ADX is rising, you have a strong downtrend.

How to Read the ADX Scale: Key Thresholds Every Trader Must Know
The Average Directional Index ranges from 0 to 100, though readings above 60 are relatively rare. Most charting platforms use a standard baseline setting of 14 periods.
Traders categorize trend environments into four primary zones based on the ADX value:
| ADX Range | Market Condition | Practical Interpretation |
|---|---|---|
| 0 – 20 | Weak or Ranging | Price is consolidating sideways; trend-following tools suffer high false-signal rates. |
| 20 – 25 | Emerging Trend | The market is transitioning out of consolidation; a potential trend is forming. |
| 25 – 40 | Strong Trend | Price momentum is high; optimal zone for trend-following systems and breakouts. |
| 40 – 100 | Extreme / Overextended | Trend is exceptionally strong, but vulnerable to exhaustion or severe pullbacks. |
When ADX lingers below 20, the market lacks strong directional momentum. During these periods, breakout strategies often lead to whipsaws (repeated false breakout signals that trigger losing trades in both directions), making range-bound trading tools more effective. Once ADX crosses above 25, trend traders gain structural statistical backing to favor momentum entries.
How Traders Use ADX in Practical Trading Systems
Integrating ADX into a trading routine helps filter out lower-probability setups. Here are three common ways systematic traders use the indicator:
1. The Trend Filter (Traffic Light System)
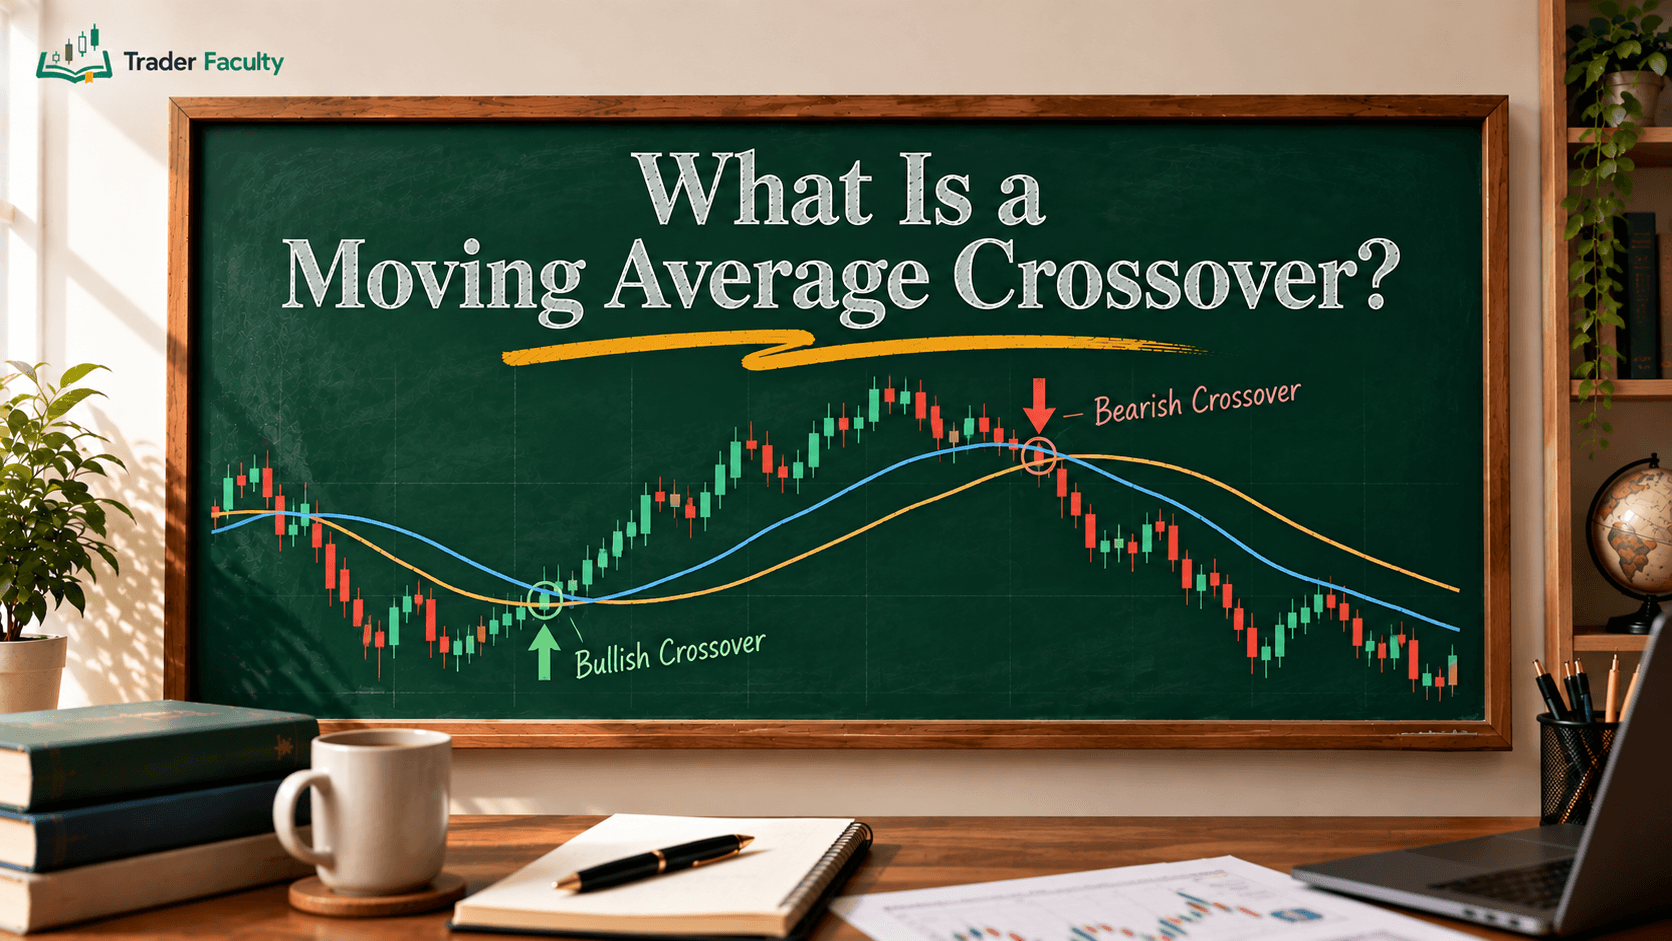
Instead of taking every moving average crossover signal, traders use ADX as a gatekeeper. If a moving average bullish crossover occurs while ADX is below 20, the trade is rejected because price is likely ranging. The trade is only executed if ADX sits above 25, confirming trend strength.
2. Identifying Range-Bound Chop
When ADX falls below 20 and points downward, it serves as an explicit warning: stop taking breakout entries. Experienced traders recognize low ADX environments as periods to sit on their hands, preserve capital, or switch from momentum strategies to mean-reversion tactics.
3. DMI Crossover Confirmations
A classic entry signal occurs when the +DI line crosses above the -DI line (bullish signal) or -DI crosses above +DI (bearish signal). However, seasoned traders wait for ADX to concurrently cross above 20 or 25 before entering, ensuring the crossover possesses enough momentum to sustain a multi-candle move.
ADX vs. Other Technical Tools: What Makes It Unique?
Understanding where ADX fits among broader technical indicators helps prevent indicator redundancy on your charts.
While oscillators like the Relative Strength Index (RSI) measure momentum by assessing whether an asset is overbought or oversold, ADX makes no judgment on valuation. RSI tells you if price has moved too far too fast relative to its recent range, whereas ADX strictly measures structural trend power.
Additionally, ADX shares mathematical DNA with volatility measurements. To understand how ADX calculates true price ranges, looking into the Average True Range (ATR) in trading provides helpful context, as both indicators rely on Welles Wilder's True Range calculation to gauge market expansion without relying solely on simple closing prices.
Common ADX Mistakes to Avoid
Despite its utility, misinterpreting the ADX indicator leads to costly execution mistakes.
- Mistake 1: Treating a rising ADX as an automatic buy signal. Remember that ADX is non-directional. A rapidly rising ADX line during a market crash indicates a powerful downtrend, not a buying opportunity.
- Mistake 2: Using trend-following rules during low-ADX regimes. Attempting to trade moving average breakouts when ADX is under 20 usually results in repeated small losses due to price whipsaws.
- Mistake 3: Expecting ADX to predict trend reversals. ADX is a lagging indicator derived from past price data. A high ADX reading above 40 confirms that a strong trend has occurred, but it does not guarantee how much longer that trend will last. As the U.S. Securities and Exchange Commission's investor education resource on technical analysis notes, indicators like ADX rely on historical price patterns and cannot reliably forecast future price movement on their own.
Conclusion
The Average Directional Index is one of the most reliable tools for gauging market regime and distinguishing strong trends from directionless consolidation. By evaluating ADX alongside directional components like +DI and -DI, traders can effectively filter out false breakouts and align their strategies with prevailing market momentum.
Frequently Asked Questions
Is a high ADX reading a buy or sell signal?
A high ADX reading is neither a buy nor a sell signal by itself. ADX measures only the strength of a trend, not its direction. A rising ADX above 25 simply indicates that the current market trend—whether bullish or bearish—is strong. To determine market direction, traders look at price action or examine whether the +DI line sits above the -DI line.
What is the best timeframe for the ADX indicator?
ADX works effectively across all timeframes, from day trading charts (like 5-minute or 15-minute charts) to swing trading charts (daily or weekly). The choice depends on your strategy. Most platforms use the standard 14-period default setting, which balances sensitivity and signal reliability across intraday, daily, and weekly price action.
What happens when +DI crosses -DI?
A directional crossover occurs when the +DI and -DI lines intersect. When +DI crosses above -DI, it signals that bullish momentum is surpassing bearish momentum, indicating a potential buy signal. Conversely, when -DI crosses above +DI, it suggests growing bearish momentum. These signals are strongest when accompanied by a rising ADX above 20.
What is the difference between ADX and RSI?
While both are momentum tools, the Relative Strength Index (RSI) measures whether an asset is overbought or oversold based on recent gains versus losses. ADX, on the other hand, strictly measures structural trend strength regardless of overbought levels. RSI answers "where is price relative to recent bounds?", while ADX answers "how strong is the current market trend?"
Can ADX be used in range-bound or sideways markets?
ADX is particularly useful in range-bound markets because it warns traders when a trend is absent. When ADX trades below 20, market price is consolidating sideways. During these low-ADX regimes, experienced traders avoid trend-following and breakout strategies, choosing instead to use mean-reversion tools or step aside until momentum returns.
The Trader Faculty Team writes and reviews every guide together — pairing hands-on market experience with a curriculum-first approach to trading education. One good syllabus, taught in the order that makes you better.