What Is BOS in Trading? Market Structure Explained
Learn what is BOS in trading, how market structure forms trends, and how to avoid fakeouts. Read the full guide.
By Trader Faculty Team
Direct Answer
A Break of Structure (BOS) is a chart event where price closes beyond an established swing high or swing low, confirming that the prevailing trend is continuing. In an uptrend, it requires creating a higher high, while in a downtrend, it requires printing a lower low. Traders use valid structural breaks to identify ongoing market momentum and filter out trend exhaustion.
A Break of Structure (BOS) in trading occurs when price pushes past a prior swing high or swing low, signaling that the current market trend remains in control.
You have likely bought a breakout only to watch price snap back against your position minutes later. Chasing fast moves without knowing whether real structure is breaking creates frustrating losses. This guide breaks down the core mechanics of market structure, how to spot genuine breaks, and how to avoid traps.
Quick Takeaways
- A valid break confirms trend continuation, meaning buyers keep forming higher highs or sellers keep printing lower lows.
- Requiring a full candle body close above or below swing levels filters out wick sweeps and false breakouts.
- Trading pullbacks after a structural break offers better risk-to-reward ratios than entering breakout candles directly.
- Checking volume tools confirms whether aggressive market participants backed the breakout move.
What Is BOS in Trading? Market Structure Basics
A break of structure (BOS) in trading is a chart event where price breaks beyond a previous swing high or swing low to confirm that the existing trend is continuing. When traders discuss the BOS in trading meaning, they are looking at how market trends sustain their direction through structural breaks. Having a clear grasp of BOS in trading explained in simple terms helps you filter out random price noise.
To understand how a break occurs, you must first understand market structure. Financial markets rarely move in a straight line. Instead, they travel in waves made of swing highs (the highest price peak before a pullback) and swing lows (the lowest price trough before a bounce).
In an uptrend, price creates a series of higher highs and higher lows. Each time buyers push price above the previous peak, they create a new high. In a downtrend, price forms lower highs and lower lows as sellers push price below the prior floor.
Think of market structure like a multistory building under construction. In an uptrend, the ceiling of the current floor is the swing high. When buyers gather enough strength to break through that ceiling and build the next level above it, a break of structure takes place. The old ceiling now becomes the new floor.
How Break of Structure Works: Bullish vs. Bearish BOS

A break of structure works by tracking whether buyers or sellers are strong enough to push price past previous turning points. Depending on the trend direction, a break takes one of two forms: bullish or bearish.
Bullish BOS
A bullish BOS occurs in an uptrend when price breaks above a prior swing high.
- Price rallies to create a swing high, then pulls back to form a higher low.
- Buyers enter the market at this higher low and push price upward with fresh momentum.
- Price crosses above the previous swing high.
This move tells you that demand still exceeds supply. Buyers were willing to pay higher prices than before, proving that the bullish trend remains healthy.
Bearish BOS
A bearish BOS occurs in a downtrend when price drops below a prior swing low.
- Price declines to set a swing low, then retraces upward to set a lower high.
- Sellers defend that lower high and push price downward again.
- Price breaks through the prior swing low.
This move tells you that supply continues to overwhelm demand. Sellers were willing to dump assets at lower prices, confirming that the bearish trend has more room to run.
The Candle Close Rule: Valid BOS vs. Wick Sweeps
A valid break of structure requires a full candle body close beyond the previous swing level, not just a temporary wick poke. Many beginners make the mistake of calling a break the exact second a price wick touches or pokes beyond a swing point. Doing so often leads directly into traps.
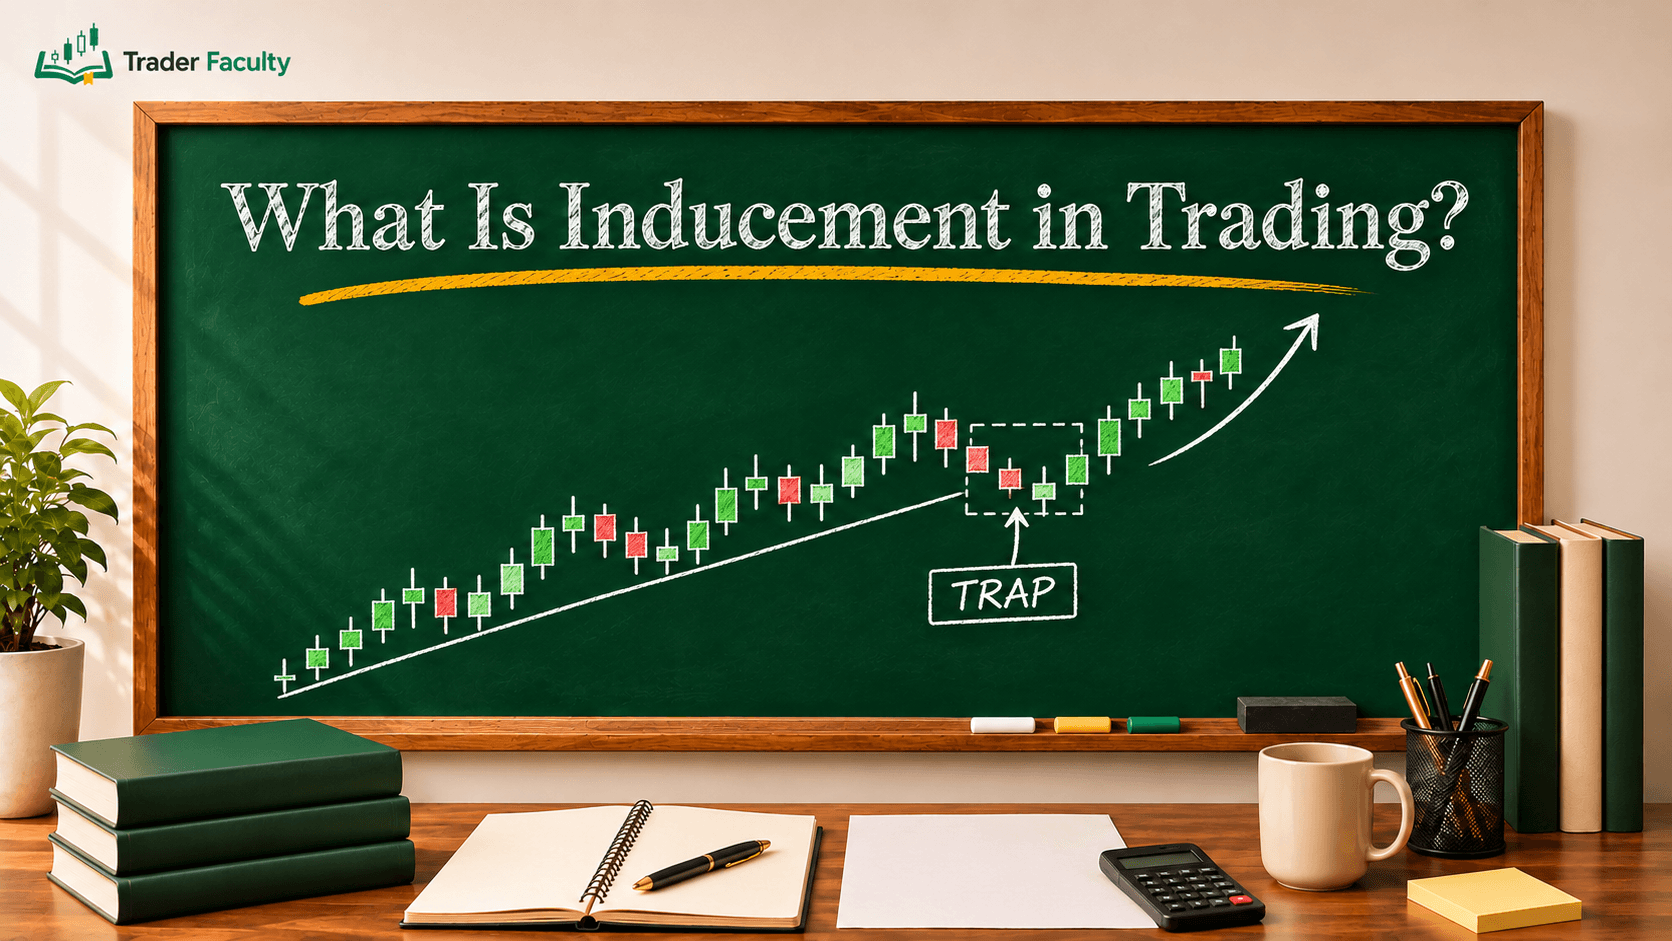
When a candle only pokes past a high or low with its wick and closes back inside the previous range, it is usually a wick sweep. In technical trading, this is often called a liquidity grab (an event where price sweeps resting orders sitting in the market before reversing).
Large institutions are often aware that retail traders place stop-loss orders just above swing highs and just below swing lows. When price briefly pierces these levels, it triggers those stops and fills institutional orders. Once those orders are filled, price snaps back in the opposite direction, creating a bull trap or bear trap.
To protect yourself from these traps, follow the candle close rule:
- Valid Bullish BOS: The candle body must close clearly above the swing high on your chosen timeframe.
- Valid Bearish BOS: The candle body must close clearly below the swing low on your chosen timeframe.
- Wick Sweep: If only the wick extends past the level while the body closes inside the range, treat the level as held, not broken.
Waiting for the candle close requires patience, but it's proof that buyers or sellers managed to keep price beyond the structural level.
For example, if a swing high forms at $1.2050 and price later closes a full candle body above that level at $1.2065, that close confirms a valid bullish BOS. If instead the candle's wick pokes up to $1.2060 but closes back down at $1.2040, the level has only been swept, not broken.
BOS vs. CHoCH: Trend Continuation vs. Reversal Signal
The difference between BOS and CHoCH is that BOS confirms a trend is continuing, while a Change of Character (CHoCH) signals that a trend might be ending or reversing. Both concepts are pillars of modern market structure, but confusing them will cause you to trade against the market.
A BOS, by definition, moves in the direction of the established trend. If the market is in an uptrend, breaking a swing high is a BOS.
A CHoCH, on the other hand, breaks the opposite side of structure. In an uptrend, the market is supposed to make higher lows. If price suddenly drops and closes below the most recent higher low, the market character has changed.
That break of the higher low is a CHoCH. It warns you that buyers failed to protect their structural floor and that sellers may be taking control.
| Feature | Break of Structure (BOS) | Change of Character (CHoCH) |
|---|---|---|
| Structural Role | Trend continuation | Early trend reversal |
| Break Direction | In the direction of the trend | Against the direction of the trend |
| Market State | Trend strength remains active | Trend momentum is weakening |
| Trade Setup | Trend-following pullbacks | Early reversal or exit warnings |
A common sequence on price charts starts with a CHoCH when the old trend cracks. After the market establishes a new direction, subsequent breaks in that new direction become standard BOS events.
How to Trade BOS: Retracement Entries and Order Flow Confirmation
Trading a break of structure works best when you wait for a price pullback into a value zone rather than buying or selling the breakout candle directly. Using BOS in trading strategies requires patience because entering at the right time matters just as much as reading the trend.
When a breakout candle closes, price is extended. Entering immediately can put your entry at a weaker location, forcing you to use a wide stop loss and exposing you to slippage (the difference between expected price and executed price).
Instead of chasing, use a structured three-step approach:
- Spot the BOS: Confirm that a candle body closed past a clear swing high or low.
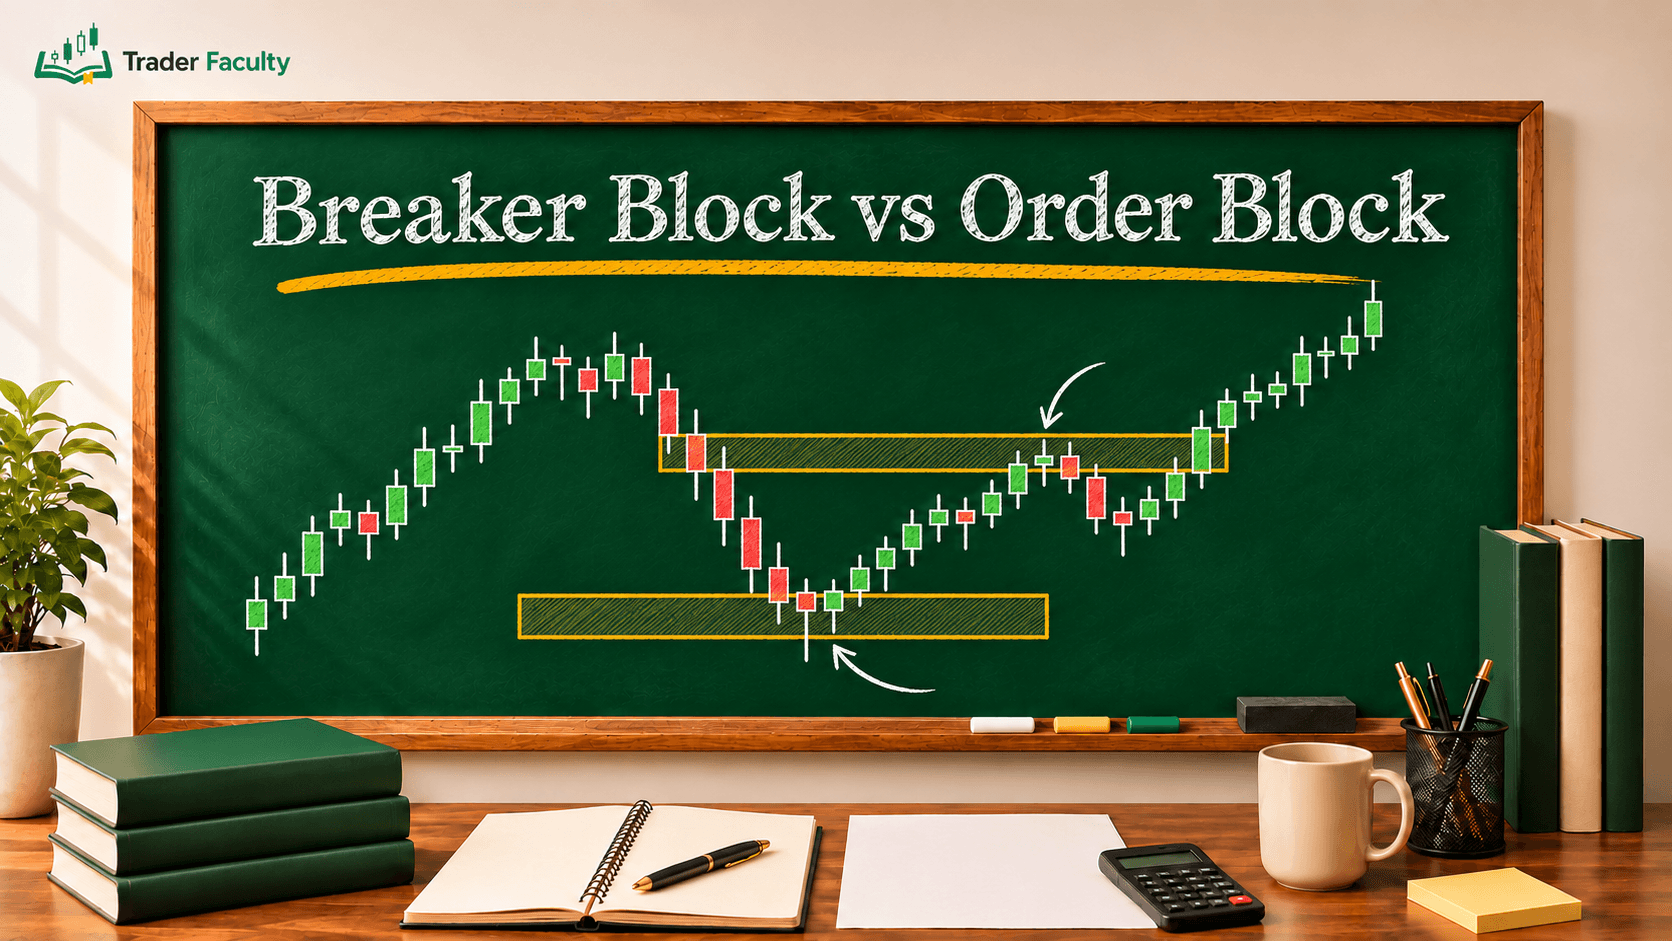
- Wait for the Retracement: Let price pull back toward an order block (a price zone where large institutions previously placed orders) or a key support/resistance area. In an uptrend, look for a pullback into a discount zone (a price area below the 50% retracement level where price is relatively cheap).
- Confirm with Order Flow: Before taking your entry on the pullback, verify market participation. By looking at a footprint chart, you can inspect volume delta (the net difference between buying and selling volume) to verify whether aggressive participants actually support the move or if volume is drying up.
You'll also need to align multiple timeframes. Market structure is fractal, meaning smaller structures exist inside larger ones. A bullish BOS on a 5-minute chart might simply be a brief counter-move heading straight into a major daily resistance zone. Identifying your main trend on a higher timeframe, such as the 4-hour or daily chart, can help here — only trade lower-timeframe BOS setups that agree with that broader direction.
Common Mistakes When Trading Break of Structure
The most common mistake when trading break of structure is buying or selling immediately when a breakout candle appears without waiting for confirmation. Fear of missing out (FOMO) makes traders rush into trades at the very top of a move, right before the market begins its natural retracement.
A second mistake is ignoring the higher-timeframe picture. If you spot a bullish BOS on a 1-minute chart, that break has very little weight if the 1-hour chart is in a heavy downtrend. Lower-timeframe breaks fail frequently because they represent short-term market noise rather than major capital flow.
A third mistake is treating internal structure as major structure. Inside any large price leg, price forms small minor peaks and troughs. If you label every minor wiggle as a BOS, your chart becomes cluttered with false signals. Focus strictly on major swing highs and swing lows that represent clear turning points.
Conclusion
Understanding what is BOS in trading gives you an objective way to read trend direction on price charts without relying on guesswork. A valid break tells you that the current trend remains intact, while distinguishing between body closes and wick sweeps keeps you out of liquidity traps. Market structure forms the foundation of modern technical analysis, helping you read raw price action clearly. Trading always carries the risk of losing capital, and no market structure pattern can remove uncertainty from financial markets, so treat this framework as education rather than financial advice.
Frequently Asked Questions
Which timeframe is best for spotting a Break of Structure?
No single timeframe is universally best for spotting a Break of Structure because market structure is fractal, although higher timeframes like the daily or four-hour chart offer the most reliable structural levels with fewer false breakouts. Intraday traders often track the higher-timeframe trend for overall direction, then look for a Break of Structure on the fifteen-minute or five-minute chart to identify precise entries.
What is the difference between a major BOS and a minor BOS?
A major Break of Structure happens when price breaks a key swing high or low that defines the overall trend on a higher timeframe, while a minor Break of Structure occurs within internal price legs on lower timeframes. While minor breaks show short-term momentum shifts, major breaks carry significantly more weight and dictate the broader market direction.
Does a Break of Structure mean the trend will continue?
A Break of Structure doesn't ensure trend continuation, because markets frequently generate false breakouts or sudden reversals due to unexpected economic news or shifting institutional liquidity. While a valid structural break shows that momentum currently favors the trend, traders must always manage risk by using protective stop losses rather than assuming the trend must continue.
Can a Break of Structure happen in a ranging market?
A Break of Structure does not occur inside a sideways consolidation because a ranging market lacks established higher highs or lower lows, so price simply bounces between support and resistance boundaries. A true Break of Structure only takes place once price convincingly breaks out of the range boundaries and begins printing directional swing points.
What indicators work best alongside Break of Structure analysis?
Order flow tools like footprint charts and volume delta work best alongside structural breaks because they reveal whether genuine market aggression drove the move. Volume indicators, such as the volume weighted average price or standard volume profiles, also help confirm whether institutional participation supported the price break or if momentum is fading.
Keep learning
TA Masterclass
Reading charts one article at a time? Get the full method, in order.
10 lessons quiz
Start TA MasterclassThe Trader Faculty Team writes and reviews every guide together — pairing hands-on market experience with a curriculum-first approach to trading education. One good syllabus, taught in the order that makes you better.