What Is Inducement in Trading? Market Traps Explained
Learn what inducement in trading is, how liquidity sweeps work, and how to avoid early traps. Read the full guide.
By Trader Faculty Team
Direct Answer
Inducement in trading refers to an internal swing high or low that lures traders into premature positions before deeper liquidity is taken. Market makers and institutional participants use these minor pullbacks to build the order volume needed to drive the larger trend. Once the inducement level is swept, price typically resumes its higher-timeframe direction.
Inducement in trading is a minor swing high or low that tempts early traders into entering positions before the market collects resting orders and continues its main move. It marks an internal pause in price, not a true trend reversal.
You have probably lived through this scenario: you spot a trend, wait for what looks like a solid pullback, and enter your trade. Minutes later, a sudden price spike sweeps right past your stop-loss, taps a slightly lower level, and takes off in the exact direction you predicted. This happens because minor chart pauses pull in impatient market orders before deeper pools of liquidity are cleared. This guide explains how inducement works, how to spot it on your charts, and how to protect your capital from early-entry traps.
Quick Takeaways
- Inducement forms at minor internal swing points rather than external trend boundaries.
- Price regularly targets these minor levels to collect resting stop orders before resuming the dominant trend.
- Waiting for price to sweep an inducement level provides better trade location and clearer invalidation points.
- High-momentum trends and major economic news releases can invalidate structural patterns without reversing.
What Is Inducement in Trading?
Inducement is an internal price level that attracts early buyers or sellers before the broader market is ready to resume its primary trend. In modern price action and Smart Money Concepts (SMC) — a popular trading style based on institutional order flow ideas — inducement is often abbreviated as IDM. It acts as temporary bait, tempting retail traders to take positions too soon based on minor chart patterns.
When price moves in an uptrend or downtrend, it rarely travels in a straight line. Between major structural peaks and valleys, the market creates smaller waves known as internal structure. Beginners often mistake the first minor pullback — a temporary move against the main trend — for a complete retracement. They rush in because of the fear of missing out, placing their stop-loss orders just behind that minor pivot.
This behavior makes inducement in trading an essential concept for understanding chart structure. Large institutional participants need counterparties to fill large orders. When thousands of traders place stop-losses at the exact same minor swing point, they create a dense pocket of orders. Price frequently moves toward this level to clear out those positions before establishing the true directional leg.
How Inducement Works: The Mechanics of Liquidity Traps

Inducement works through the natural mechanics of order matching in a continuous auction market. Every market participant needs someone on the other side of their trade: a buyer needs a seller, and a seller needs a buyer. Curriculums published by the CFA Institute explain that market price levels reflect the continuous balance of supply and demand created by resting market orders.
To understand the lifecycle of this setup, follow this 5-step cycle:
- The impulsive leg: The market makes a strong, directional move, setting a new major swing high or low.
- The internal pullback: Price pauses and forms a shallow retracement. This first minor pivot becomes the inducement level.
- The retail trap: Early traders view this shallow bounce as confirmation that the trend is resuming. They enter long or short and place protective stop-loss orders tightly behind the new pivot.
- The liquidity sweep: Price turns back, breaking through the minor pivot. This event is a liquidity sweep — a quick move past a price level to trigger resting stop orders before reversing.
- The institutional fill: The triggered stop-losses become market orders that provide liquidity. Price reaches a deeper key area, such as an order block — a specific price area where institutions previously placed heavy orders — and then launches into the true trend continuation.
For example, say a stock rallies from $48 to $52, pulls back to $50.20 (the inducement level), then sweeps down to $49.90 before reversing and continuing toward $55 — the brief dip below $50.20 is the liquidity sweep that clears out early stop-losses before the real move resumes.
It’s worth noting that this isn’t a personal conspiracy where a broker hunts your individual account. Resting stop orders naturally cluster around visible chart swing points, simply because many traders use the same reference points to set their stops. The market moves toward areas of high liquidity because that's where trades can be executed with minimal slippage.
Inducement vs. Liquidity Sweep: What Is the Difference?
While both terms describe price taking out resting orders, inducement and liquidity sweeps serve different functions in market structure analysis. Inducement refers specifically to internal, minor swing points created during a trend leg. A general liquidity sweep, on the other hand, often refers to external structural points, such as equal highs, equal lows, or major multi-day extremes.
| Feature | Inducement (IDM) | Major Liquidity Sweep |
|---|---|---|
| Chart Location | Internal structure (first minor pullback) | External structure (key swing highs and lows) |
| Market Role | Validates structural swing points | Signals deep corrections or major trend reversals |
| Target Audience | Traps early trend-continuation traders | Traps breakout traders at obvious chart boundaries |
| Expected Reaction | Brief dip followed by trend continuation | Sharp, sustained move in the opposite direction |
Recognizing this difference keeps you from misinterpreting the chart. An inducement sweep is an invitation to look for a continuation entry within the existing trend. A major structural sweep often warns you that the entire trend might be ending.
How to Identify and Trade Inducement on a Chart
Identifying inducement requires patience because the setup asks you to do the opposite of what your instincts suggest. Instead of buying the first sign of strength, you must wait for the initial bounce to fail.
- Mark external structure: Identify the overall trend on your higher timeframe. Locate the most recent major swing high and swing low.
- Find the first internal pullback: After a strong break of structure — when price breaks a previous major swing high or low — watch for the first valid internal retracement. Mark the lowest point of that pullback in an uptrend (or the highest point in a downtrend) as your inducement line.
- Wait for the sweep: Let price drop below this mark. Don’t buy while price is slicing through this level. Wait for candle wicks to show that resting orders have been absorbed.
- Seek multi-factor confirmation: Instead of guessing where price will turn, smart traders look for confluence between a swept inducement level, an unfilled imbalance (a price gap left where buy and sell orders haven't yet been matched), and a major support zone before taking a position.
When Inducement Fails: Trend Momentum and Invalidation
No technical concept works every single time, and treating inducement as a certainty is a fast way to damage your account. Market context always overrides structural patterns.
The most common failure occurs during high-momentum runs. In a runaway bull or bear market, buying or selling pressure is so strong that price doesn’t need to collect internal liquidity. It simply blasts through minor pullbacks and continues running. If you sit on your hands waiting for an inducement sweep that never comes, you’ll miss the entire move.
High-impact macroeconomic news also shatters technical inducement setups. Major interest rate decisions, inflation reports, or employment figures create rapid repricing across all asset classes. In these environments, price will easily slice through inducement levels, order blocks, and structural swing points without showing any reaction. Always define your invalidation level — the exact price point where your trade idea is proven wrong — before placing an order.
Common Mistakes Beginners Make with Inducement
Traders learning this concept often struggle during their first few weeks of chart application. Watch out for these 3 pitfalls:
- Labeling every minor candle as inducement: Not every two-pip pause on a one-minute chart represents a valid setup. Focus on clear, visible pullbacks on your primary trading timeframe.
- Entering directly on the inducement level: Beginners often place limit orders right at the inducement line, thinking it will act as support. The entire purpose of inducement is that price breaks through it to gather orders below.
- Trading against higher-timeframe order flow: Spotting an inducement sweep on a 5-minute chart means very little if the daily timeframe is crashing into a major resistance zone. Always align your trades with the higher-timeframe trend.
Conclusion
Understanding what inducement is in trading changes how you view chart patterns. Instead of viewing sudden wicks through support levels as bad luck, you begin to recognize them as normal liquidity collection. Waiting for price to sweep internal pullbacks protects you from entering too early and gives you a clear structural invalidation point for your stop-loss.
Inducement isn’t a magic system, but learning how it works gives you a cleaner perspective when studying technical analysis and planning your trades. Always remember that trading carries the risk of losing money, so test these structural ideas on a demo account before risking real capital.
Frequently Asked Questions
What does IDM stand for in Smart Money Concepts (SMC)?
In Smart Money Concepts (SMC), IDM stands for inducement — the first internal swing point or minor pullback created after a significant market move. Traders identify IDM to avoid entering too early, waiting instead for price to sweep the level and clear resting stop-loss orders before looking for a valid entry.
Does inducement work on lower timeframes like the 1-minute or 5-minute chart?
Yes, market structure is fractal, so inducement patterns appear on all timeframes from monthly down to one-minute charts, though lower timeframes carry much more noise and false signals from routine bid-ask spread variations. For greater reliability, traders usually identify major structure on higher timeframes like the 4-hour or daily chart before hunting inducement lower down.
How do you confirm that an inducement sweep is valid?
A valid sweep occurs when price trades beyond the minor swing point and quickly leaves a rejection wick rather than closing strongly past it. Traders confirm this reaction by looking for momentum deceleration, an immediate shift in lower-timeframe candle structure, or price tapping into an unmitigated order block or support zone before reversing in the intended trend direction.
What is the difference between inducement and an order block?
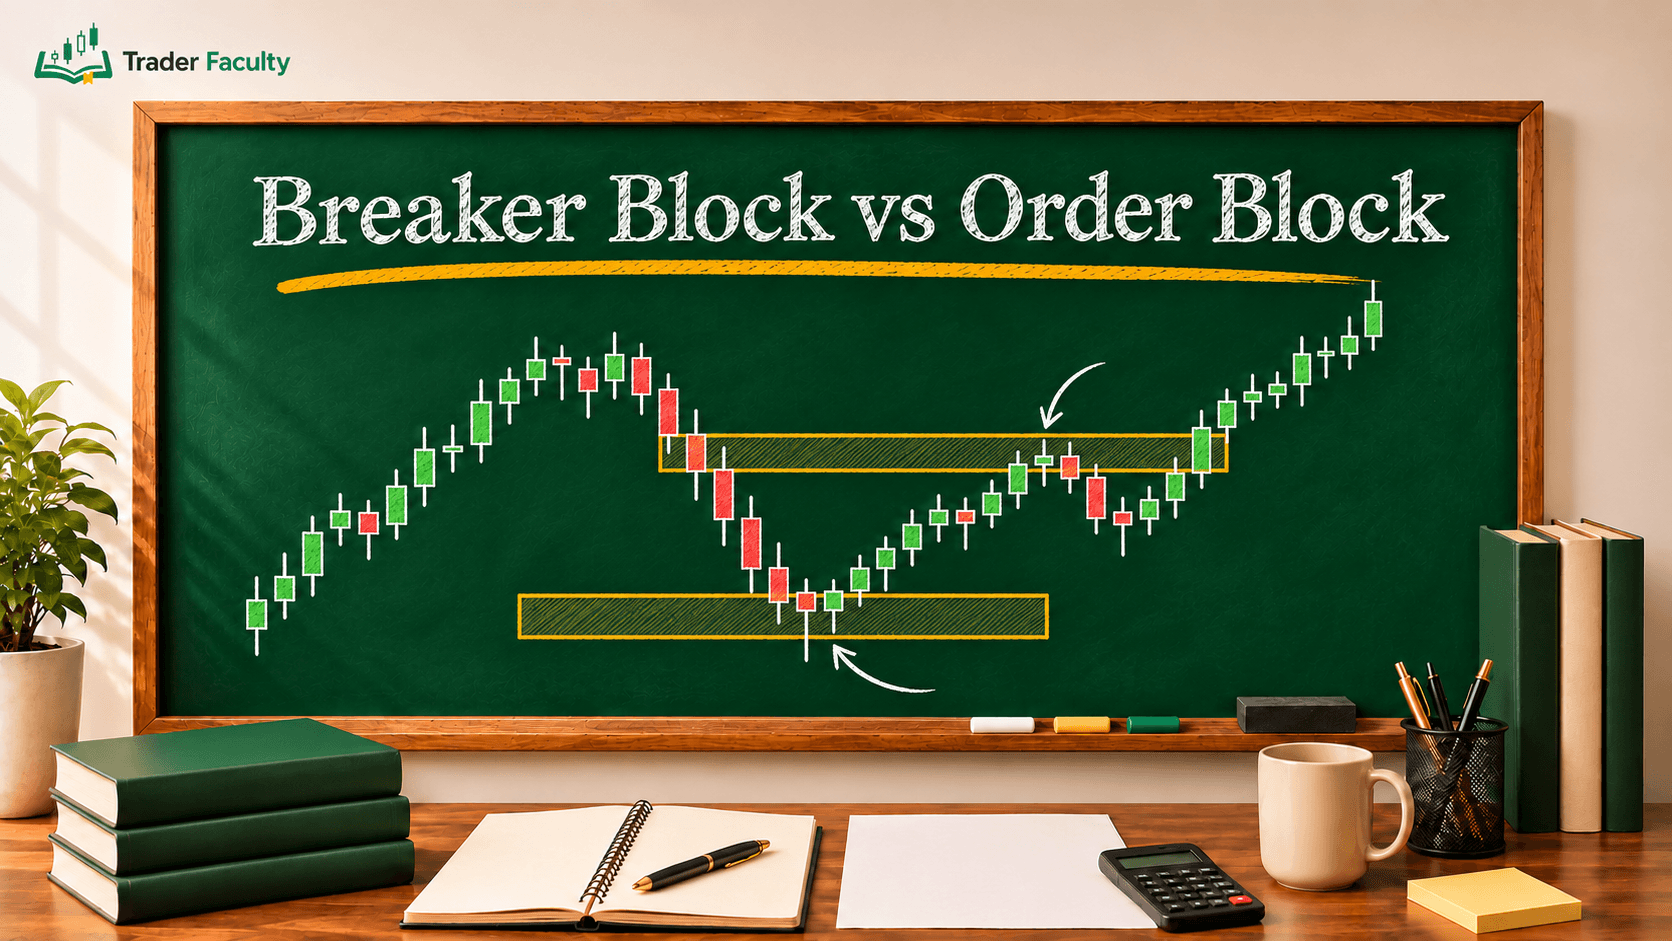
An inducement level is a target for price to take out, representing trapped liquidity from early retail traders, while an order block is an entry zone where institutional orders were previously placed. In a typical setup, price sweeps the inducement level first and then mitigates the nearby order block before resuming the dominant trend.
Can you trade inducement without using other Smart Money Concepts?
Yes — in traditional charting, an inducement sweep is simply a false breakout or bull/bear trap that sweeps liquidity, so you can combine it with classical technical analysis tools. You can pair inducement levels with standard support and resistance, moving averages, or candlestick reversal patterns without adopting the rest of the SMC terminology.
Keep learning
TA Masterclass
Reading charts one article at a time? Get the full method, in order.
10 lessons quiz
Start TA MasterclassThe Trader Faculty Team writes and reviews every guide together — pairing hands-on market experience with a curriculum-first approach to trading education. One good syllabus, taught in the order that makes you better.