What Is MACD in Trading?
Learn what MACD is and how to use this momentum indicator to confirm market trends. Read the full guide.
By Trader Faculty Team
Direct Answer
The Moving Average Convergence Divergence (MACD) is a trend-following momentum indicator that calculates the difference between two exponential moving averages. By measuring price velocity and trend strength relative to a signal baseline, it helps traders confirm market direction and spot momentum exhaustion.
The Moving Average Convergence Divergence (MACD) is a trend-following momentum oscillator that calculates the relationship between two exponential moving averages to measure price velocity and direction.
Many new traders see the crossing lines and fluctuating histogram bars on their charts without understanding what drives them behind the scenes. Relying blindly on every crossover often leads to getting caught in sideways noise and buying at market peaks.
Understanding how MACD measures momentum helps you confirm structural trends, filter out false breakout signals, and time entries with greater confidence.
Quick Takeaways
- MACD tracks price momentum and trend direction by measuring the distance between two moving averages.
- The indicator features three distinct components: the MACD Line, the Signal Line, and the visual Histogram.
- Histogram contractions often provide an early warning of fading momentum well before a line crossover occurs.
- Because MACD relies on historical price data, it is a lagging indicator that can generate false signals during sideways market consolidation.
What Is the MACD Indicator?
The MACD—short for Moving Average Convergence Divergence—is a core technical momentum oscillator designed to identify emerging trends and shifting market strength.
Created by Gerald Appel in the late 1970s—a history documented by CFA Institute and major financial-education sources—the MACD indicator remains one of the most popular technical indicators in modern chart analysis. Unlike simple bounded oscillators that stay locked between 0 and 100 (such as RSI), MACD moves freely around a central zero line, expanding and contracting alongside market volatility.
The core logic of MACD hinges on two dynamic relationship states:
- Convergence: Occurs when two moving averages contract toward each other, signaling that price momentum is slowing down or consolidating.
- Divergence: Occurs when moving averages expand away from each other, indicating that price velocity and trend strength are accelerating.
Think of MACD as a vehicle's speedometer relative to its acceleration. While price shows how far the market has traveled, MACD reveals whether the market is actively stepping on the gas or pumping the brakes.
Anatomy of MACD: Understanding the Three Key Components
The MACD indicator consists of three distinct mathematical elements plotted together in a sub-chart window below price action: the MACD Line, the Signal Line, and the MACD Histogram.
To read the tool accurately, you must understand how these three components interact:
- The MACD Line: This is the fast-reacting line on the chart. It is calculated by subtracting a longer-term 26-period Exponential Moving Average (EMA) from a shorter-term 12-period EMA (12 EMA - 26 EMA). Because it measures the direct distance between two moving averages, it rises when short-term price momentum outpaces the long-term trend.
- The Signal Line: This is the slower-reacting trigger line. It represents a 9-period EMA calculated directly from the MACD Line itself. By smoothing out the raw MACD Line, the Signal Line helps filter out sudden price spikes and provides clearer trade trigger references.
- The MACD Histogram: This visual bar graph plots the quantitative gap between the MACD Line and the Signal Line. When the MACD Line sits above the Signal Line, the histogram renders above the zero baseline; when the MACD Line drops below, the histogram turns negative.

Novice traders often wait for the fast MACD Line to cross the Signal Line before reacting. However, observing the histogram bars shrinking toward the zero line gives you an early warning that momentum is drying up before the actual crossover takes place.
Key Signals: How Traders Read MACD
Traders read MACD by analyzing three primary visual signals: signal line crossovers, zero line crossovers, and momentum divergences.
1. Signal Line Crossovers
Signal line crossovers represent the primary entry and exit cues generated by the indicator:
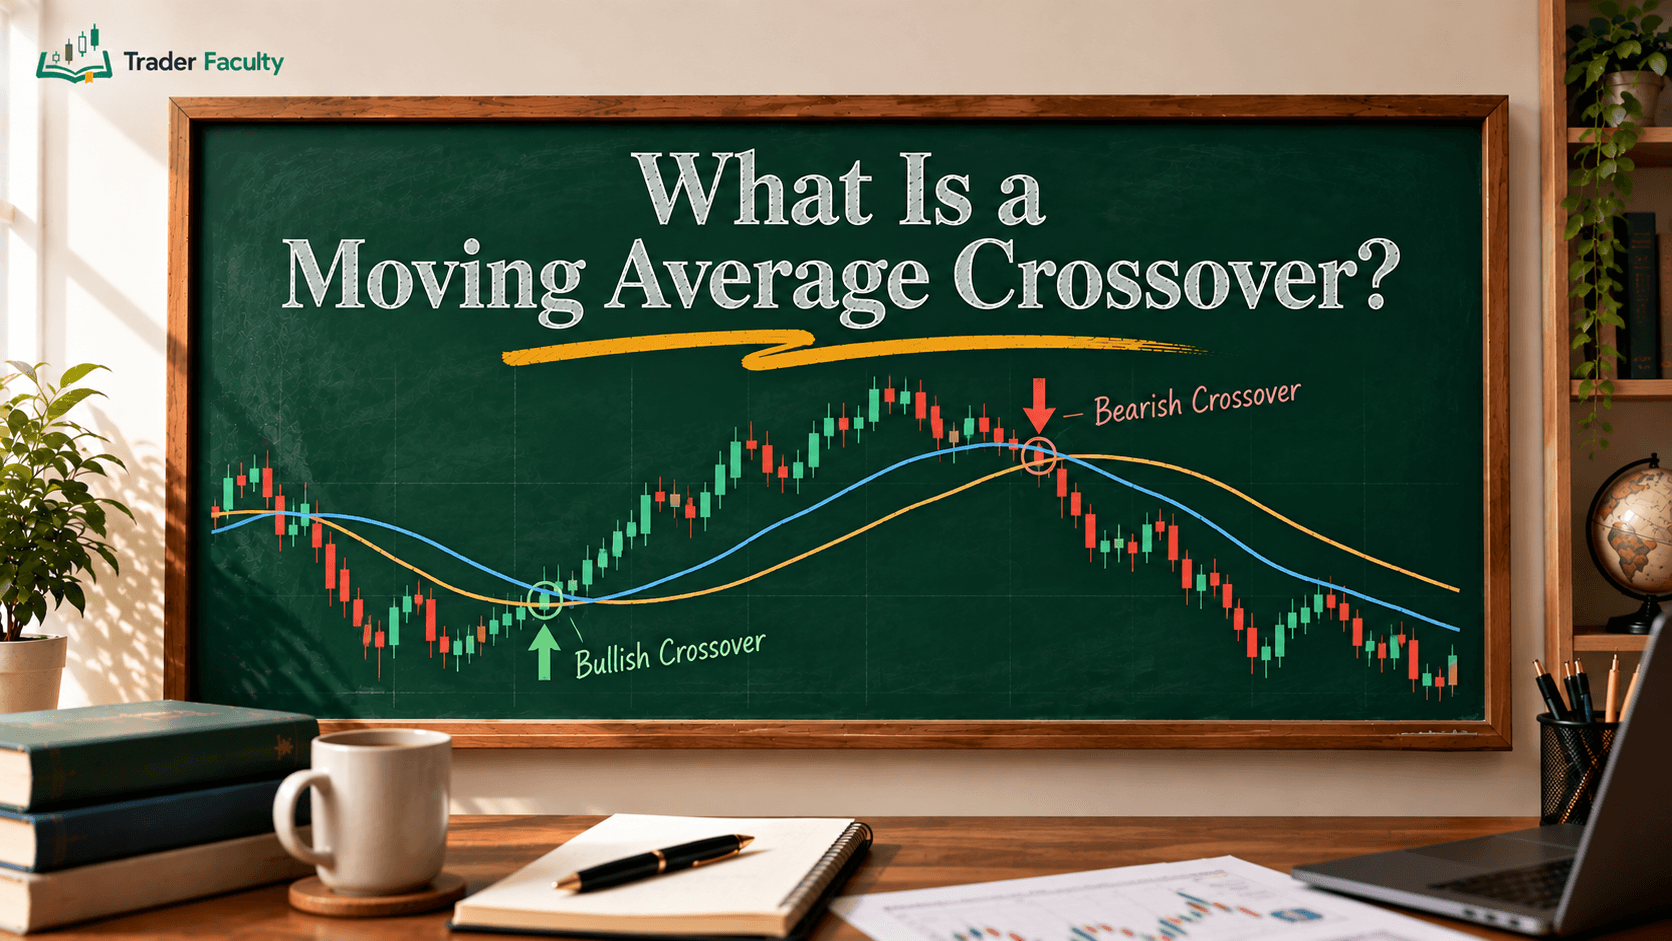
- Bullish Crossover: Occurs when the MACD Line crosses above the Signal Line. This indicates that short-term price velocity is accelerating upward, often interpreted as a buying signal.
- Bearish Crossover: Occurs when the MACD Line crosses below the Signal Line, signaling that downside momentum is taking over.
2. Zero Line Crossovers
The central zero line represents the equilibrium point where the 12 EMA and 26 EMA are equal in value:
- Positive Zone (Above Zero): Confirms that short-term average price action is trading above longer-term price action, indicating a broader bullish market regime.
- Negative Zone (Below Zero): Confirms that short-term prices are below the long-term average, establishing an overall bearish regime.
3. MACD Divergence
Divergence occurs when price action and the MACD indicator move in opposite directions, warning that the prevailing trend is losing steam:
- Bullish Divergence: Price makes a lower low, but the MACD indicator forms a higher low. This indicates that selling pressure is weakening despite lower market prices, often setting up a bullish reversal.
- Bearish Divergence: Price pushes to a higher high, but MACD forms a lower high. This reveals underlying exhaustion among buyers, signaling a potential downward correction.
How to Build a Real-World MACD Trading Strategy
Building a robust MACD trading strategy requires pairing indicator momentum with market structure, key support levels, and overall trend context.
The most important rule in technical analysis is to never trade momentum signals in isolation. Because MACD is derived from historical prices, executing every crossover blindly will result in getting chopped up during low-volatility periods.
Combining MACD with Support and Resistance
Instead of taking every bullish crossover, wait for price to pull back to a horizontal support level or trendline. If a bullish signal line crossover forms precisely as price bounces off strong support, the confluence of structural price support and turning momentum dramatically increases the setup's probability
Trend Alignment
You can refine your strategy by pairing the indicator with a longer-term moving average (such as a 200-period SMA) to determine macro market direction. When price trades above the 200 SMA, focus exclusively on taking bullish MACD crossovers. When price trades below, limit your trades to bearish crossover signals.
Common Pitfalls: The "Whipsaw" Trap in Ranging Markets
The single biggest limitation of MACD is its vulnerability to false signals—known as whipsaws—when markets move sideways in tight consolidation ranges.
The Sideways Range Trap
Because MACD relies on moving average spreads, flat sideways consolidation causes the MACD Line and Signal Line to repeatedly weave back and forth around the zero line. Traders who treat every MACD crossover as an automatic order trigger will suffer compounding losses from bad fills and transaction spread costs during non-trending phases.
The Lagging Nature of Derived Data
Because moving averages process historical price data, MACD is fundamentally a lagging indicator. It confirms momentum shifts after price movement has already begun rather than predicting exact reversal points. Expecting MACD to spot absolute price tops or bottoms usually leads to late entries and poor risk-reward ratios.
Over-Fitting Parameter Settings
While standard trading software defaults to the classic (12, 26, 9) settings, beginners frequently tweak these lookback periods to fit specific historical charts. Customizing lookback settings to past price data often results in curve-fitting, which fails when applied to live, unpredictable market conditions. Stick with standard settings while focusing your analysis on price structure.
Conclusion
The MACD indicator provides traders with a practical visual tool for gauging momentum, trend direction, and underlying market velocity. While line crossovers and histogram changes offer useful context, the tool is most effective when combined with key structural levels, risk management rules, and trend filters.
To build a balanced trading approach, explore our overarching framework on technical analysis to see how momentum indicators complement broader price action concepts.
Frequently Asked Questions
What does MACD stand for in technical analysis?
MACD stands for Moving Average Convergence Divergence. Created by Gerald Appel in the late 1970s, it is a technical momentum indicator that measures the relationship between two exponential moving averages (EMAs) to evaluate market trend strength, speed, and overall direction.
What are the standard default settings for MACD?
The standard default parameters for the MACD indicator are 12, 26, and 9. The MACD Line is calculated by subtracting the 26-period EMA from the 12-period EMA, while the Signal Line is formed by a 9-period EMA of the MACD Line itself.
Is MACD a leading or lagging indicator?
MACD is fundamentally a lagging indicator because its calculations are derived directly from historical moving average data. While it measures momentum effectively, it confirms existing market trends and shifts rather than predicting exact future price turning points before they happen.
What is the difference between MACD and RSI?
While both evaluate momentum, MACD measures the distance between two exponential moving averages without absolute boundary limits. RSI (Relative Strength Index) measures price momentum speed on a fixed scale bounded between 0 and 100 to identify overbought or oversold market conditions.
Why does MACD generate false signals in sideways markets?
In sideways or ranging markets, price moves horizontally without a clear directional trend. Because moving averages continuously weave around each other during flat price consolidation, the MACD Line and Signal Line produce frequent, conflicting crossovers known as whipsaws.
The Trader Faculty Team writes and reviews every guide together — pairing hands-on market experience with a curriculum-first approach to trading education. One good syllabus, taught in the order that makes you better.