What Is a Black Swan Event? Meaning and Market Examples
Learn what a black swan event means in financial markets, explore classic crash examples, and protect your capital. Read the full guide.
By Trader Faculty Team
Direct Answer
A black swan event is a rare, unforeseen occurrence in financial markets that causes widespread damage and is explained away with hindsight after it happens. These events lie far outside regular statistical models, so risk tools like stop-loss orders can suffer large slippage (the gap between expected and actual fill price). Because they can't be timed, active traders protect their accounts through conservative position sizing and low leverage.
A black swan event is an unpredictable shock that goes far beyond normal market expectations, causes major damage, and is later explained away as if people should have seen it coming.
Most traders build their strategies around normal market conditions, assuming their stop-loss orders will protect them from sudden market turns. When a true crisis hits, prices gap past order levels, liquidity vanishes, and accounts suffer severe losses.
This guide breaks down what the term means, classic historical examples, why standard risk controls can fail during sharp moves, and how you can protect your trading capital without living in constant fear.
Quick Takeaways
- A true black swan meets three criteria: rarity, large impact, and hindsight explanation.
- Stop-loss orders can't fully protect you in a crash, because prices can gap past your set level.
- Normal distribution models (bell curves) can underestimate market risk by treating large moves as nearly impossible.
- True black swans cannot be timed, so sensible position sizing and low leverage remain your strongest defenses.
What Is a Black Swan Event? Plain Definition and Meaning
A black swan event is a rare outlier that catches the whole financial market off guard and creates widespread disruption. The phrase comes from seventeenth-century Europe, where people believed all swans were white because no one had ever seen a different kind. That belief vanished in 1697 when Dutch explorer Willem de Vlamingh sighted black swans in Western Australia, showing that a single observation can overturn a long-held belief.
In financial markets, the term refers to unexpected shocks that standard statistical models fail to forecast. Author Nassim Nicholas Taleb popularized the idea in his 2007 book The Black Swan, arguing that financial institutions lean on fragile statistical models. When an unexpected crisis hits, it can expose flaws across the financial system.
The Three Core Attributes of a Black Swan
A market crash or economic shock must meet three conditions to qualify as a true black swan:
- Rarity (Outlier Status): The event lies outside regular expectations. No historical data in recent memory pointed to its arrival, so standard forecasting tools had little to say about it.
- Major Impact: The shock carries severe consequences across asset classes, such as large corporate insolvencies, liquidity freezes (times when buyers and sellers disappear), or deep price collapses.
- Retrospective Predictability (Hindsight Bias): After the event unfolds, analysts and commentators build explanations that make it look obvious all along. This hindsight bias (seeing past events as more predictable than they were) can create a false sense that the next shock will be easy to spot.
Classic Black Swan Examples in Financial Markets

Real market history shows what these shocks look like in practice, though experts still debate how unforeseeable each one really was:
- The 1987 Black Monday Crash: On October 19, 1987, the Dow Jones Industrial Average dropped 22.6% in a single day. According to the Federal Reserve's history of the crash, portfolio insurance (a hedging technique that uses futures and options) accelerated the decline as early losses led to more selling.
- The 2008 Global Financial Crisis: The collapse of the U.S. subprime mortgage sector (loans made to borrowers with weaker credit) set off a worldwide banking freeze, and Lehman Brothers filed for bankruptcy in September 2008. Many analysts argue that risk models assumed housing prices wouldn't fall nationwide at once, which left major institutions unprepared. For background, see the Federal Reserve's essay on the subprime mortgage crisis.
- The 2015 Swiss Franc De-Pegging: On January 15, 2015, the Swiss National Bank (SNB) unexpectedly discontinued its minimum exchange rate of 1.20 Swiss francs per euro, as its official press release confirms. The franc jumped sharply within minutes, and some leveraged brokers and funds reported heavy losses.
| Event | Date | Market Impact | Primary Cause |
|---|---|---|---|
| Black Monday | October 1987 | DJIA fell 22.6% in one day | Portfolio insurance and selling cascades |
| Global Financial Crisis | September 2008 | Worldwide banking freeze | Subprime credit contagion |
| SNB Currency Shock | January 2015 | EUR/CHF fell sharply within minutes | Sudden removal of exchange rate floor |
Black Swan vs. Grey Swan Events
Not every crisis is a black swan. A grey swan is an event that is rare and impactful, but known and somewhat foreseeable. Some analysts classify recessions, known debt ceilings, or anticipated pandemic outbreaks as grey swans because the risks had already been widely discussed. A black swan, by contrast, is an unknown shock that mainstream models didn't account for.
Why Standard Risk Controls Can Fail in a Crash
Standard trade management tools often fail during sharp market shocks because they depend on active liquidity (enough buyers and sellers to trade quickly):
- The Stop-Loss Illusion: A stop-loss order tells your broker to close your trade once price reaches a level you pick. It usually fills at the next available market price, so it's not a guaranteed shield. If a market gaps overnight or halts trading, that price can land far below your exit level.
- Liquidity Vacuums and Slippage: During sudden shocks, many buyers step away. This vacuum can cause large slippage (the gap between your intended exit price and the actual execution price).
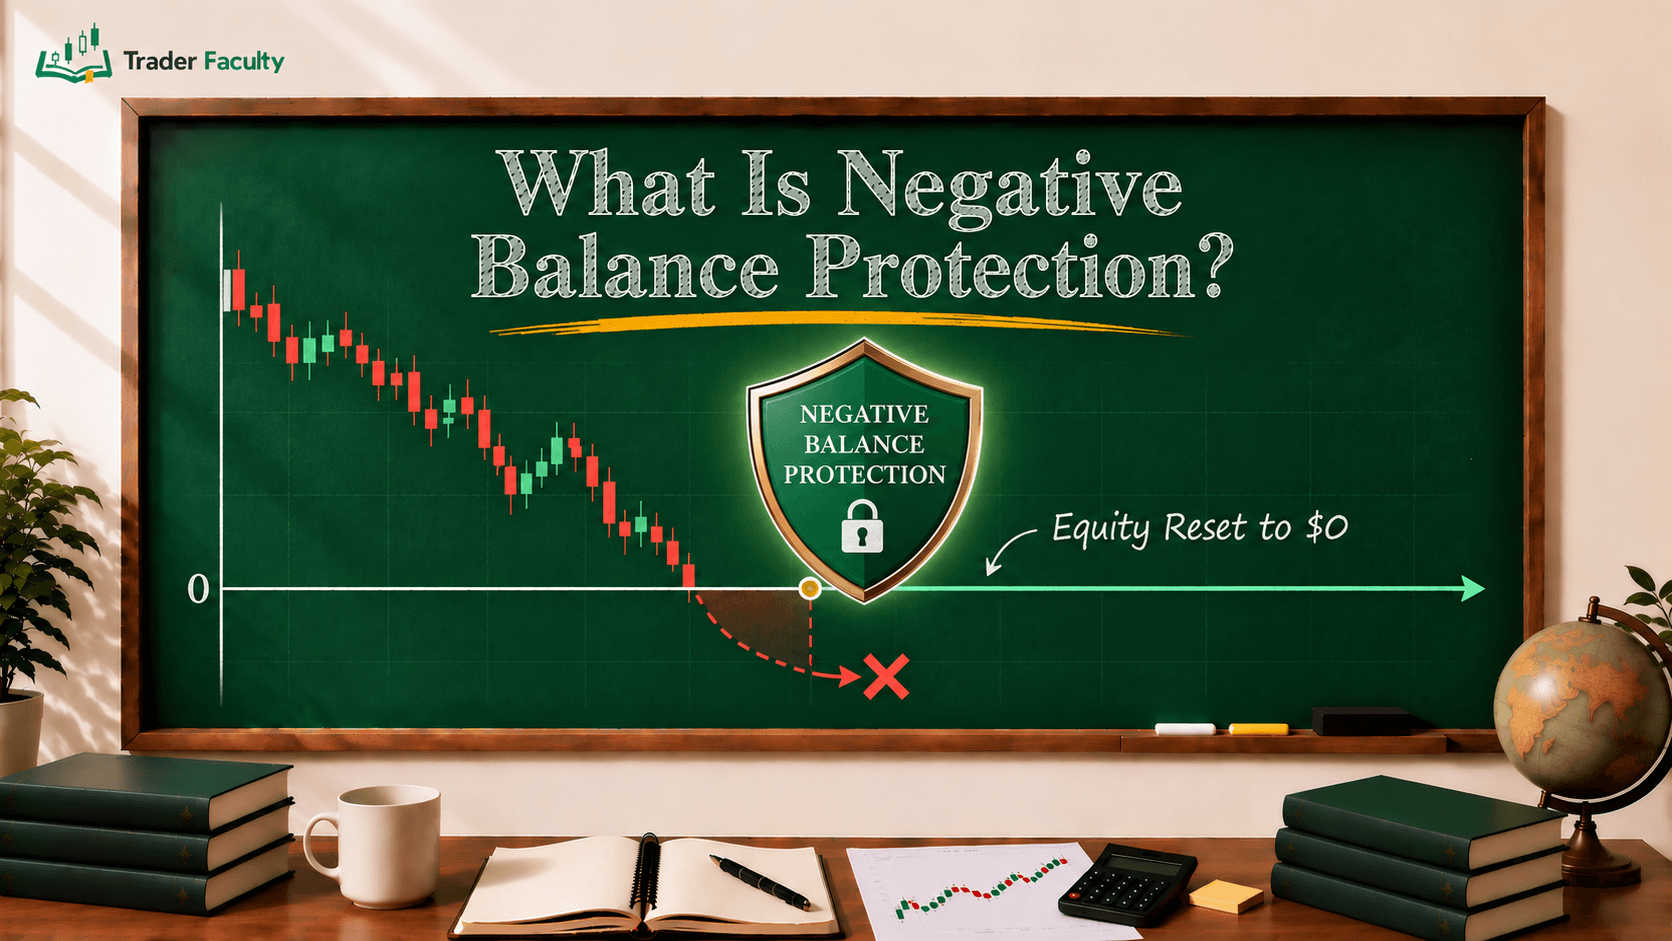
- Negative Account Balances: With high leverage (borrowed money that magnifies gains and losses), a big price gap can wipe out your margin (the deposit that backs your position) before your broker can close the trade. Depending on your broker and region, you could end up owing more than you deposited.
Understanding Tail Risk and Market Outliers
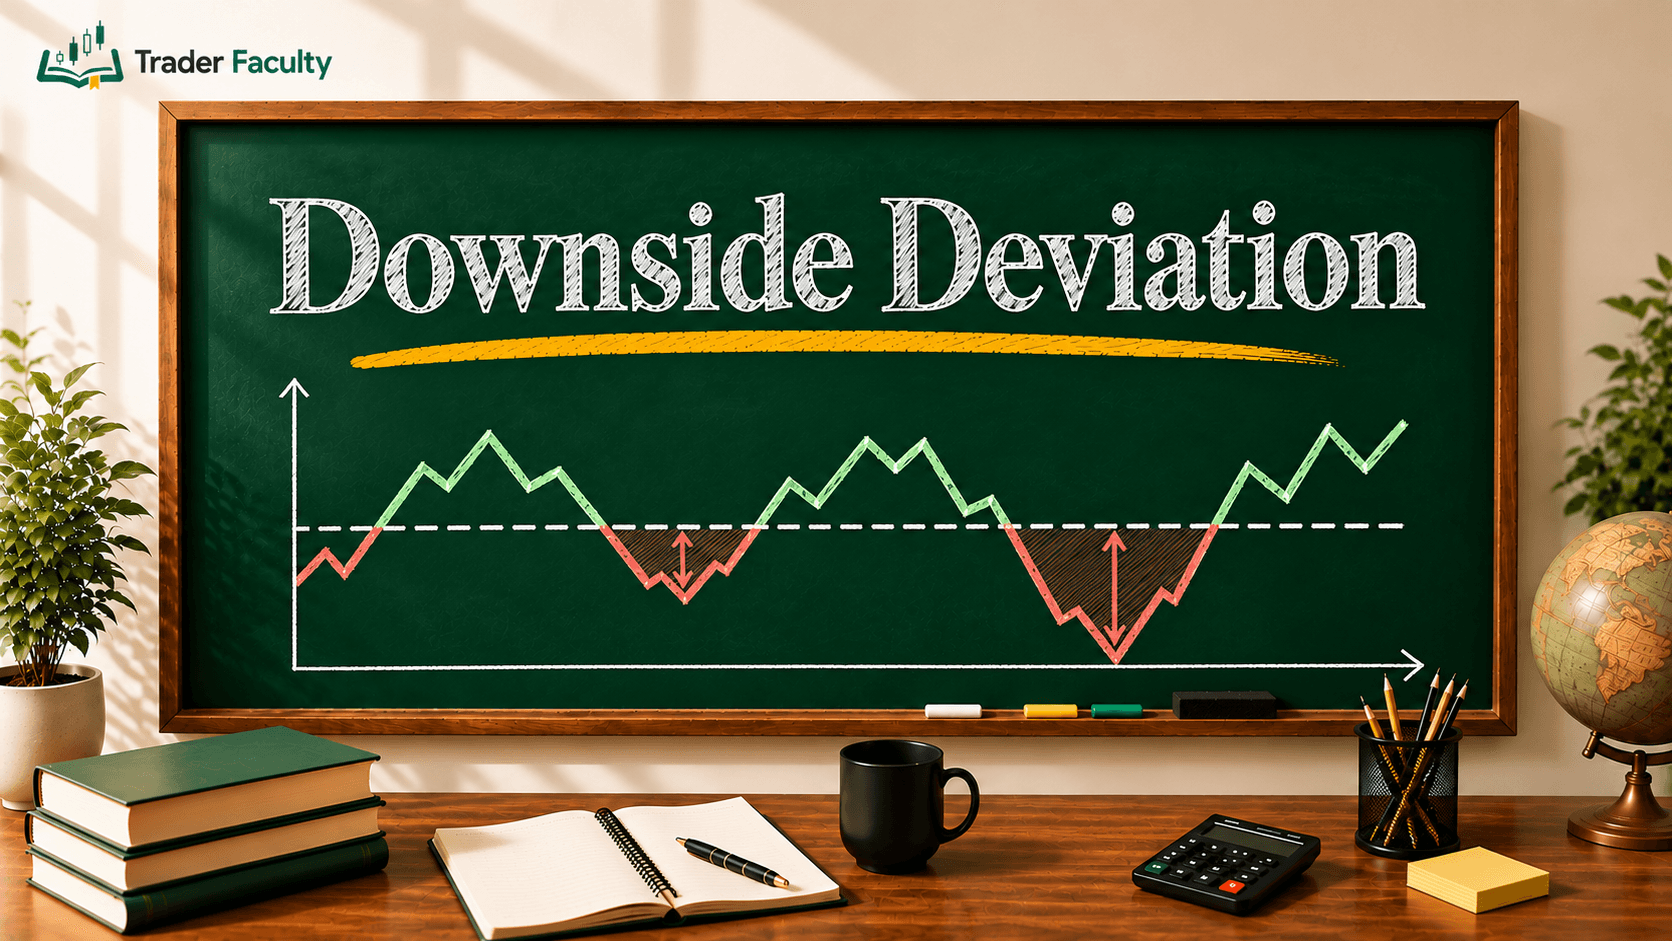
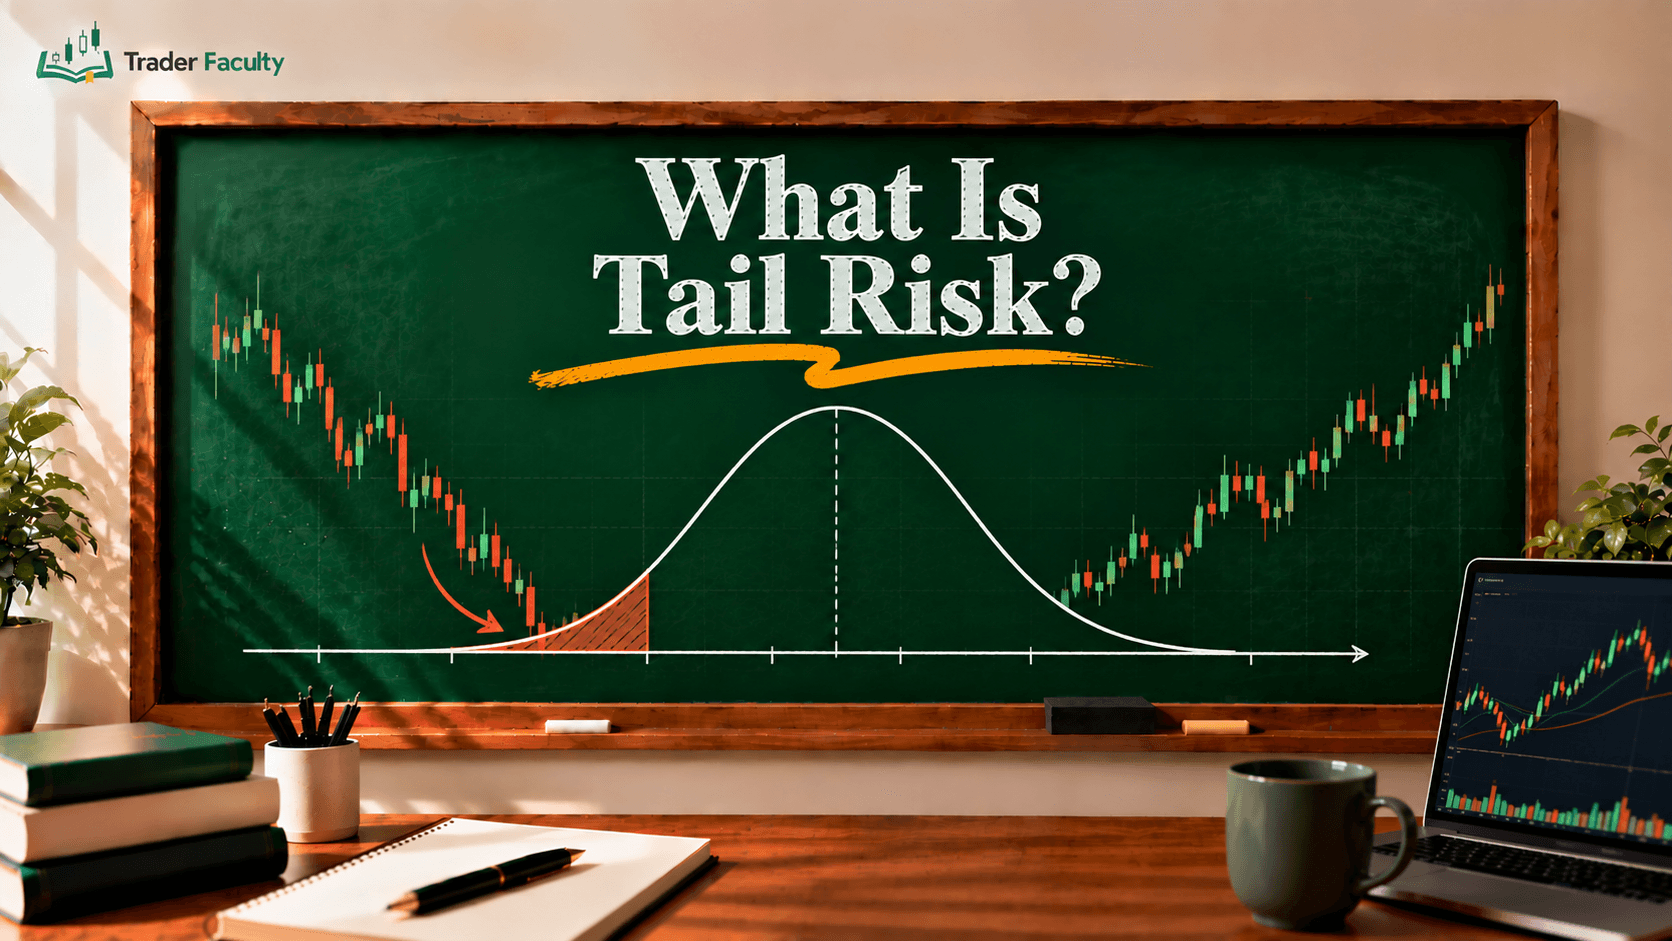
Traditional risk models often assume that price changes follow a normal distribution, also known as a bell curve. Under that assumption, large daily swings are treated as "three-sigma" or "six-sigma" events (moves of three or six standard deviations, a common measure of spread) that should almost never happen.
Real-world returns don't follow a perfect bell curve. Instead, they show fat tails, meaning extreme outcomes happen more often than those formulas predict. Traders study tail risk (the chance of rare, high-damage market moves) to understand how those outliers can hit a portfolio. When you recognize that outlier moves are a normal feature of liquid markets, you can build a risk plan around survival rather than prediction.
How Traders Can Protect Their Capital
Because you can't predict when the next shock will hit, your defense should focus on steady portfolio safety:
- Limit Your Leverage: Leverage multiplies losses during sudden price gaps. Keeping your borrowed exposure low helps your account withstand surprise volatility without forced liquidation (your broker closing positions for you).
- Maintain Cash Reserves: Holding unallocated cash helps you meet margin requirements (the collateral your broker asks for) during turbulent periods and gives you capital to deploy if assets trade at steep discounts.
- Size Positions Conservatively: Avoid risking a large percentage of your portfolio on any single trade or correlated group of assets. If a shock hits one sector, small position sizes can protect your broader balance.
- Avoid Constant Over-Hedging: Buying out-of-the-money put options (contracts that gain value when prices fall) can offset crash losses, but paying option premiums (the upfront cost) month after month drains capital in normal conditions. Balance protective hedges with position-size limits.
Common Mistakes Traders Make Around Market Shocks
- Assuming Stop-Loss Orders Guarantee Zero Loss: Believing an automated order prevents all downside can push traders toward too much leverage, leaving them exposed to slippage during market gaps.
- Over-Hedging Out of Fear: Spending too much portfolio capital on disaster insurance erodes long-term gains, turning fear of a crash into a slow capital bleed.
- Confusing Normal Volatility with Black Swans: Labeling routine economic data releases or expected corporate earnings misses as black swans distracts from fixing fundamental flaws in trade execution.
Conclusion
A black swan event can't be predicted, timed, or fully avoided, but you can limit its damage to your account. Surviving rare market outliers requires recognizing that standard statistical models can underestimate risk, stop-loss orders have execution limits during market panics, and leverage can turn a temporary shock into a permanent loss.
Building a lasting career in financial markets starts with mastering risk management so that an unforeseen market shock doesn't end your journey. Financial markets carry the real risk of losing capital, so treat all trading education as a framework for your own analysis rather than personalized financial advice.
Frequently Asked Questions
Can you predict a black swan event with technical analysis?
Technical analysis can't predict a black swan event because chart patterns and indicators rely on historical price patterns. True black swans are unprecedented shocks with no footprint in past data. Trying to time one with indicators often leads to false signals and poor trade execution.
Was the 2020 COVID-19 market crash a black swan event?
Many commentators called the 2020 market crash a black swan, but author Nassim Nicholas Taleb has described it as a "white swan" (a foreseeable event). Health experts had warned for years that a pandemic was possible. Because the risk was known and discussed, it didn't strictly meet the definition of an unforeseen shock.
Does a guaranteed stop loss protect you in a market crash?
A guaranteed stop-loss order can protect an individual trade from gap risk because the broker agrees to fill it at your stop price. However, only some brokers offer guaranteed stops, and they usually charge an extra fee or widen spreads. Standard stop-loss orders can still suffer large slippage during extreme volatility.
What is the difference between tail risk and a black swan?
Tail risk is the statistical chance of a very large price move, often defined as three or more standard deviations from an asset's average return. A black swan is a specific, unforeseen tail event that catches the market unprepared and does lasting damage. Tail risk is the statistical concept, while a black swan is a real-world example.
Why do bell-curve models fail during market shocks?
Normal distribution models, or bell curves, assume that price moves cluster closely around an average, which makes large swings look nearly impossible. Real market returns show fat tails, where extreme outliers occur more often than those formulas suggest. Relying only on bell-curve models can leave traders exposed to heavy losses when volatility spikes.
Keep learning
Risk & Money Management
One good article won't save your account. A risk framework will.
7 lessons quiz
Start the courseThe Trader Faculty Team writes and reviews every guide together — pairing hands-on market experience with a curriculum-first approach to trading education. One good syllabus, taught in the order that makes you better.