What Is Value at Risk? How Traders Measure Downside
Learn how value at risk estimates portfolio loss thresholds and downside exposure. Read the full guide.
By Trader Faculty Team
Direct Answer
Value at Risk (VaR) is a quantitative risk assessment metric that estimates the minimum expected loss of an investment portfolio over a designated time period at a specified confidence level. It identifies the boundary where tail losses begin under normal market conditions, rather than projecting the absolute maximum financial loss.
Value at Risk (VaR) is a statistical metric that measures the minimum dollar loss you can expect on a portfolio over a specific timeframe at a chosen confidence level.
Every trader knows that losing days are part of the game, but guessing how much money you might lose leads to emotional exits and poor position sizing. Value at Risk gives you a clear statistical baseline based on past price action, helping you evaluate whether your current portfolio can survive normal market volatility. This guide explains how the formula works, how to calculate your exposure step by step, and the practical limits of the model.
Quick Takeaways
- Value at Risk estimates your minimum expected loss under normal market conditions, never your absolute worst-case scenario.
- Every calculation requires three components: a specific time horizon, a chosen confidence level, and your total portfolio value.
- The model does not measure the severity of losses once market conditions breach the statistical threshold.
- Quantitative risk figures work best as an account-level budget alongside hard stop-loss orders.
What Is Value at Risk?
Value at Risk, commonly referred to as VaR, tells you the minimum amount of capital you stand to lose on a portfolio over a set period at a given probability level.
Traders use VaR as a downside boundary line. If you run the numbers on your account and determine that your 1-day 95% Value at Risk is $300, it means that on 95 out of 100 trading sessions, your expected daily loss should stay below $300. On the remaining 5 sessions out of 100, market conditions will push your loss past that $300 line.
To see how this works in daily life, think of a local weather forecast. If the morning report shows a 5% chance of rain, you can expect to stay dry 95% of the time. However, that 5% probability tells you nothing about whether the rain will be a light drizzle or a destructive flood. VaR operates the same way: it marks where your worst trading days begin, but it does not tell you how severe those bad days will get.
How Value at Risk Works: The 3 Core Elements

Value at Risk works by combining three core inputs into a single statistical statement: a time horizon, a confidence level, and a loss amount.
- Time Horizon: The time horizon is the holding period over which you measure downside exposure. Intraday and swing traders typically use a 1-day horizon to evaluate overnight exposure. Long-term investment funds and institutional desks often use 10-day or 30-day horizons to match their broader portfolio rebalancing cycles.
- Confidence Level: The confidence level represents the statistical certainty of your calculation. The two standard benchmarks in quantitative finance are 95% and 99%. A 95% confidence level means you expect losses to exceed the threshold roughly 5% of the time (about one trading day per month). A 99% level creates a wider margin, meaning losses should exceed the threshold on only 1% of trading days (about two to three sessions per year).
- Loss Amount: The loss amount is the final dollar figure or percentage produced by the model. It states the boundary of your expected drawdown under standard market behavior.
A higher confidence level doesn't make your positions safer; it simply expands the threshold to cover rarer price swings. A 99% VaR dollar figure will always be larger than a 95% VaR figure for the same account because it accounts for more extreme market moves.
The Value at Risk Formula and 3 Calculation Methods
The standard parametric value at risk formula calculates downside exposure by multiplying total portfolio value by asset volatility and the statistical critical value of your chosen confidence level.
VaR = Portfolio Value × (Portfolio Volatility × Z-Score)
In this formula, Portfolio Value represents your total account equity, Portfolio Volatility is the daily standard deviation of your historical returns, and the Z-Score is the statistical multiplier taken from a standard normal distribution table. For a 95% confidence level, the standard one-tailed Z-score is 1.65. For a 99% confidence level, the one-tailed Z-score is 2.33.
Traders and risk analysts arrive at this metric using three primary calculation methods:
- Historical Simulation: This method compiles your past trading returns, sorts them from best to worst, and identifies the return at your chosen percentage cutoff (such as the 5th percentile for a 95% confidence test). It is straightforward because it requires no assumptions about mathematical curves, but it assumes future price behavior will mirror the past.
- Parametric Method (Variance-Covariance): This method uses the formula shown above, relying on historical mean returns and standard deviation. It calculates quickly and works well for simple portfolios, but it assumes returns fit a symmetrical bell curve, which real financial markets rarely do.
- Monte Carlo Simulation: This approach uses computer algorithms to simulate tens of thousands of potential future price paths using random variables. It handles complex option portfolios well, but it requires specialized software and strong computational power.
| Method | Best For | Core Advantage | Main Weakness |
|---|---|---|---|
| Historical Simulation | Standard stock and currency portfolios | Requires no statistical distribution assumptions | Relies entirely on past price history |
| Parametric Method | Rapid daily portfolio assessments | Simple and fast mathematical calculation | Assumes returns follow a normal bell curve |
| Monte Carlo Simulation | Non-linear options and derivatives books | Models complex, non-linear scenarios | Demands specialized code and computing power |
How to Calculate Value at Risk Step by Step
To calculate Value at Risk using the parametric approach, you define your account balance, measure your daily return volatility, look up the required Z-score, and solve the equation.
Here is a practical walkthrough for calculating 1-day 95% VaR on a $10,000 equity portfolio:
- Identify account equity: In this setup, your total portfolio balance is $10,000.
- Calculate daily volatility: Review the daily closing percentage changes of your account over the last 100 trading sessions. Suppose the standard deviation of your daily returns comes out to 1.5% (expressed as 0.015 in decimal form).
- Select the Z-score: For a 95% confidence level, the critical value from the normal distribution is 1.65.
- Multiply the variables: Apply the formula:$10,000 × (0.015 × 1.65) = $247.50
The result is $247.50. Under normal market conditions, you have 95% statistical confidence that your portfolio will not lose more than $247.50 over the next trading day. This means that across 20 trading sessions, you should expect roughly one day where market losses push beyond this $247.50 threshold.
Why Value at Risk Matters for Active Traders
Value at Risk gives active traders an objective way to measure total account risk across multiple positions rather than analyzing each trade in isolation.
When you hold several open positions, the real danger is correlation — when seemingly unrelated assets fall at the same time during broad market stress. A trader holding positions in tech equities, industrial commodities, and foreign exchange might believe their capital is well distributed. However, calculating portfolio VaR takes covariance into account, showing whether a single shift in market sentiment will drag all those trades down together.
VaR also provides a clear framework for account-level risk budgeting. By setting an upper boundary on your daily VaR — such as deciding that total portfolio VaR should never exceed 2% of total equity — you prevent yourself from adding too much size after a series of winning trades.
Common Value at Risk Mistakes and Model Limits
The most dangerous mistake traders make with Value at Risk is treating the calculated number as a maximum possible loss rather than a probability threshold.
- Treating VaR as a Worst-Case Ceiling: VaR tells you only the boundary where the worst 5% or 1% of outcomes begin. It provides zero information about how far losses can run once price crosses that line. If your daily 95% VaR is $247.50, your loss on a severe day could be $300, $800, or more.
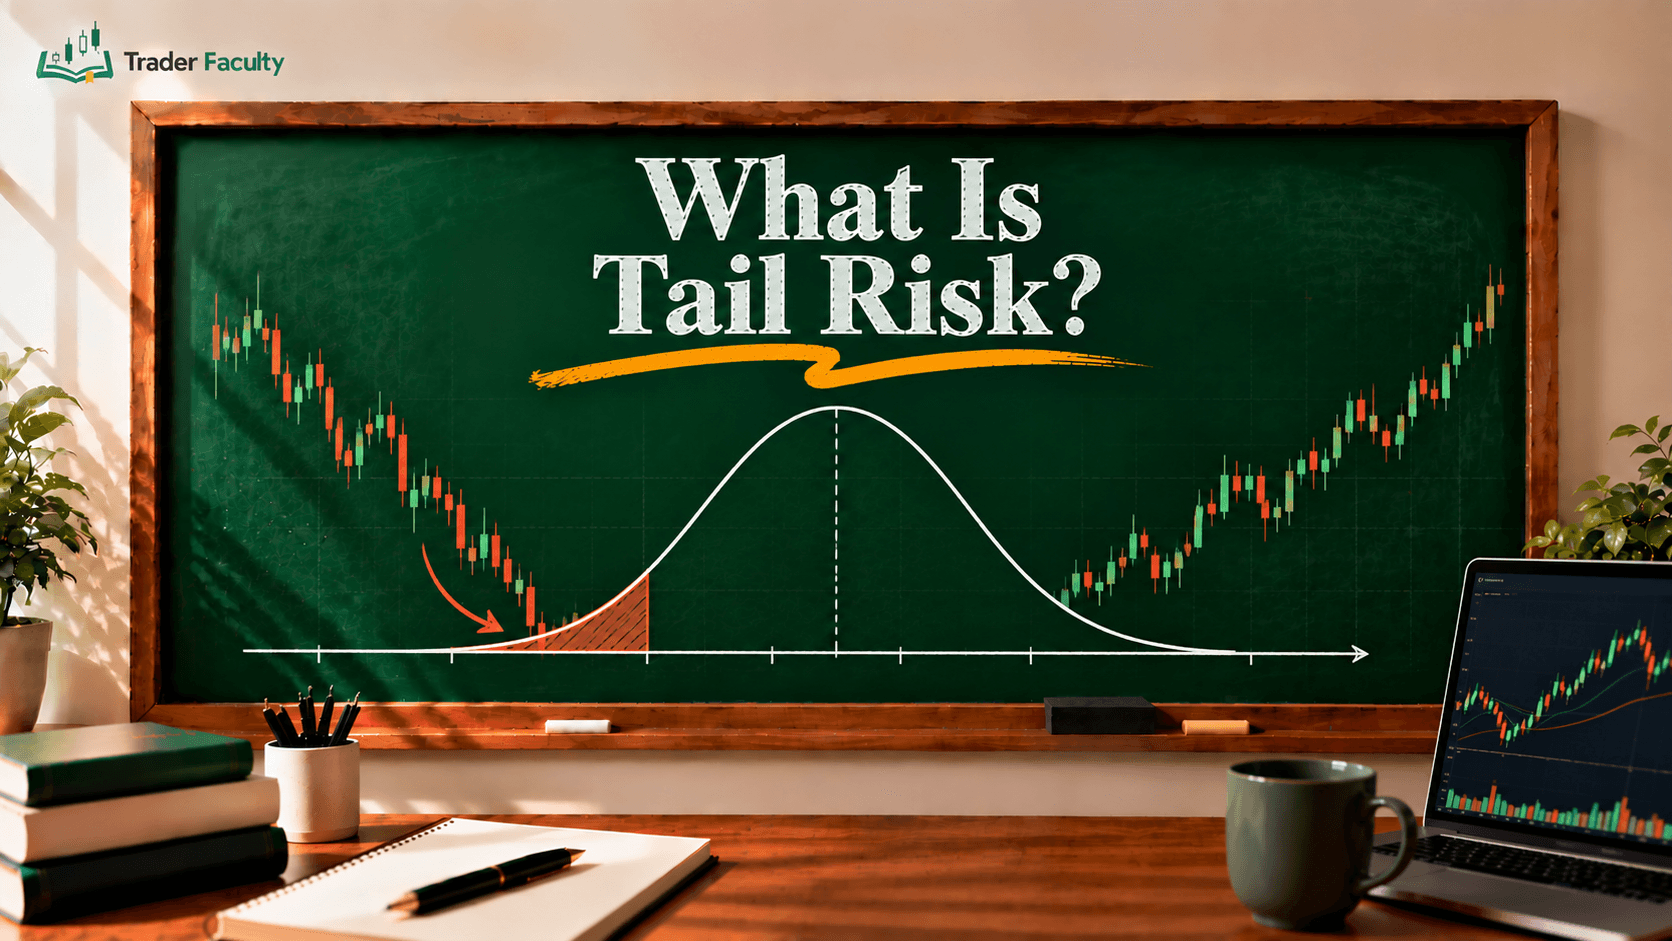
- The Normal Distribution Fallacy: Parametric models assume financial asset returns follow a smooth bell curve. In reality, financial markets exhibit fat tails (leptokurtosis), meaning extreme price spikes and sudden crashes happen far more frequently than standard bell curves suggest.
- Vulnerability to Tail Events: When an unexpected black swan event strikes, correlations spike toward 1.0, market liquidity dries up, and real-world losses easily dwarf statistical models. Because standard VaR cannot capture what happens deep inside the tail, professional risk managers pair VaR with Expected Shortfall to measure extreme downside. Expected Shortfall, also called Conditional VaR, measures the average loss that occurs after the VaR cutoff is breached.
Conclusion
Value at Risk provides a structured, objective method for measuring potential daily downside before you commit trading capital. While it cannot predict unexpected market shocks or replace trade-level stop orders, it shows whether your overall exposure fits within your total account size. Combining quantitative models with a disciplined approach to risk management trading keeps you grounded across all market environments. Trading financial markets involves the risk of losing capital, so treat statistical indicators as educational planning tools rather than assurances of account safety.
Frequently Asked Questions
How does Value at Risk differ from Expected Shortfall?
Value at Risk identifies the dollar threshold your losses should not exceed at a given probability level, but it ignores the depth of losses beyond that boundary. Expected Shortfall, also called Conditional VaR (CVaR), measures the average loss incurred once price breaches the VaR threshold, providing a clearer assessment of extreme tail risk.
Why do financial models use a 99% confidence level instead of 100%?
A 100% confidence level is statistically impossible in open financial markets because price outcomes do not have absolute boundaries. Market prices are subject to unexpected shocks, regulatory shifts, and liquidity shortages. A 99% confidence level accounts for nearly all standard trading conditions while acknowledging that extreme tail events can still occur.
How do you choose the right time horizon for Value at Risk?
Your time horizon should reflect how long you typically hold assets and how quickly you can exit positions under pressure. Day traders and swing traders use a 1-day horizon to assess overnight risk. Institutional funds managing illiquid securities use 10-day or 30-day horizons to account for the time needed to unwind positions without moving the market.
Can Value at Risk be applied to crypto and forex markets?
Yes, Value at Risk applies to foreign exchange and cryptocurrency portfolios, but high volatility requires caution. Crypto markets trade 24/7, while forex trades 24/5 with a weekend close, and both frequently experience sharp price spikes that violate normal distribution curves. Traders analyzing crypto or leveraged currencies must use historical simulation or adjust for fat tails to avoid underestimating risk.
Does a low Value at Risk mean a trade is safe?
No, a low Value at Risk only indicates that losses are expected to remain small under ordinary historical volatility. It doesn't account for sudden liquidity freezes, unexpected slippage, or severe market gap events. Traders must always combine statistical estimates with platform stop-loss orders and sound position sizing.
Keep learning
Risk & Money Management
One good article won't save your account. A risk framework will.
7 lessons quiz
Start the courseThe Trader Faculty Team writes and reviews every guide together — pairing hands-on market experience with a curriculum-first approach to trading education. One good syllabus, taught in the order that makes you better.