What Is Alpha in Trading? Excess Returns Explained
Learn what is alpha in trading, how to calculate excess returns, and how to spot real edge. Read the full guide.
By Trader Faculty Team
Direct Answer
What is alpha in trading? It's the excess return an active trading strategy produces relative to a benchmark index, adjusted for the volatility and risk taken. A positive alpha means a trader's timing or asset selection added value above market returns. A negative alpha shows that active decisions underperformed the benchmark once risk and trading costs are factored in.
What is alpha in trading? It measures how much an active strategy beats a benchmark index after adjusting for risk. It represents the value your specific choices add beyond the natural movement of the broader market.
Many traders finish a strong month with a 10% gain and assume they have a sharp edge. Yet if the broader index climbed 15% over that same window, the trader actually lost ground. This guide answers "what is alpha in trading?" so you can see through pure market momentum, measure real skill, and protect your capital from silent underperformance.
Quick Takeaways
- Alpha measures pure outperformance compared to a benchmark, not just raw account profit.
- High returns gained by taking outsized risks represent market exposure (beta) or leverage, not genuine trading skill.
- Trading costs like spreads, slippage, and commissions frequently turn positive paper gains into negative net alpha.
- Lasting alpha tends to decay over time as other market participants spot and trade the same patterns.
What Is Alpha in Trading? The Core Definition
Alpha in trading is a metric that shows whether an active strategy earned more or less than expected, based on the risk taken. If your account gains 20% while taking twice the volatility of a market that also gained 20%, your raw profit is high, but your alpha may be zero or negative.
To grasp the answer to "what is alpha in trading?", picture walking on an airport moving walkway. The belt represents the broader market, carrying everyone forward at a baseline speed, and your own walking speed on top of it is alpha. If the belt moves at three miles per hour and you walk at two, your total speed is five, so your personal effort added two miles per hour of excess speed. If you stop walking, the belt still carries you forward, and that baseline progress belongs to the market, not your legs.
In live markets, raw gains easily fool new traders. You might buy five tech stocks during a strong bull run and make 25% in three months. That looks impressive on a broker statement, but if a simple passive fund tracking that same sector gained 30% over the exact same period, your active decisions cost you 5%. True alpha exists only when your timing, asset selection, or execution beats an appropriate passive benchmark.
Alpha vs. Beta: Trader Skill vs. Market Exposure
The main difference between alpha and beta is that beta measures market-driven exposure, while alpha measures strategy-driven excess return. Beta tells you how sensitive your portfolio is to swings in the wider market, while alpha tracks the value your decisions create independently of those market swings.
When you buy an index fund tracking the S&P 500, your portfolio has a beta of 1.0. If the index climbs 10%, your position climbs 10%; if it drops 10%, you lose 10%. You didn't generate alpha because you simply rode the general tide. If you use leverage to double that position, your beta becomes 2.0, so a 10% index gain lifts your balance 20%, but only because you took twice the market risk.
Alpha represents performance that broad market movements cannot explain. It is the net result of your trade entries, stop-loss placement, position sizing, and emotional discipline.
| Factor | Beta (Market Exposure) | Alpha (Trader Edge) |
|---|---|---|
| Core definition | Return from broad market movement | Excess return from active decisions |
| Primary driver | Overall economic and sector trends | Trade timing, asset selection, and risk rules |
| Cost to achieve | Very low through passive index funds | High through research, execution, and fees |
| Risk type | Systematic market risk | Strategy breakdown and operational friction |
| Typical target | Match the market benchmark (1.0) | Beat the risk-adjusted benchmark (> 0.0) |
How Alpha Is Calculated: Plain English Math
You calculate basic alpha by subtracting the benchmark return from your strategy's total return over the same period. For example, if your trading account gained 14% this year and your chosen benchmark gained 10%, your simple excess return is 4%.
Simple Alpha = Strategy Return - Benchmark Return
While simple alpha is easy to run, professional traders rely on risk-adjusted alpha, known as Jensen's Alpha, to confirm that those extra gains didn't come from reckless risk. Jensen's Alpha uses the Capital Asset Pricing Model (a formula linking expected return to market risk) to determine what return a trader should have made given the volatility they took on.
First, you calculate your expected return based on your portfolio's beta and the risk-free rate (the return on safe cash assets like short-term government treasury bills):
Expected Return = Risk-Free Rate + Beta × (Benchmark Return - Risk-Free Rate)
Once you have that baseline expectation, you subtract it from your actual return to find Jensen's Alpha:
Jensen's Alpha = Actual Return - Expected Return
Here's a practical example:
- Risk-free rate (cash yield): 4%
- Benchmark return (broader market): 10%
- Market risk premium (benchmark minus risk-free rate): 6%
- Strategy beta (your volatility level): 1.5
- Strategy actual return: 14%
First, calculate your expected return: 4% + 1.5 × (10% - 4%) = 4% + 9% = 13%. Now, calculate Jensen's Alpha: 14% - 13% = +1.0%.
Because your actual return of 14% beat the risk-adjusted hurdle of 13%, you generated a positive alpha of 1%. If your strategy had returned 12% instead, your alpha would be negative 1%. That means you took on 50% more market exposure (a beta of 1.5) than the index without earning enough to justify it.
Interpreting the Score: Positive, Zero, and Negative Alpha
An alpha score tells you whether your active trading added value, matched the market, or lost capital relative to your risk profile. A score above zero shows outperformance, zero shows market-matching return, and a score below zero shows underperformance.
- Positive Alpha (> 0): Your trade selection and timing produced more profit than expected for the volatility you absorbed. Even a modest positive alpha of 2% to 3% per year is often considered strong when sustained across multiple market cycles.
- Zero Alpha (= 0): Your portfolio delivered the exact return predicted by its market exposure. An index fund after management fees often produces an alpha close to zero or slightly below.
- Negative Alpha (< 0): You earned less than the return expected for your risk level. If your account grew 8% while taking on enough volatility to require 12%, you produced negative alpha.
Generating lasting positive alpha is challenging. The S&P Indices Versus Active (SPIVA) U.S. Scorecard from S&P Dow Jones Indices found that 67% of active large-cap U.S. equity funds underperformed the S&P 500 in the first half of 2026, after 79% did so across full-year 2025.
The Hidden Friction: Fees, Slippage, and Alpha Decay
The main reason active strategies fail to generate positive net alpha is operational friction, which includes commissions, bid-ask spreads, and order slippage. A strategy can produce great numbers on a clean backtest spreadsheet, but real-world execution costs steadily chew away your edge.
Every time you cross the bid-ask spread or face slippage on a market order, you give away fractions of a percent. For a swing trader making five trades a month, that friction remains minor. For an active day trader executing multiple trades a day, transaction costs can eat a meaningful share of account equity over a year. Gross alpha is what you make on paper; net alpha is what remains in your account after your broker takes their cut.
Another challenge is alpha decay. Markets are dynamic, competitive environments. When an inefficiency or chart pattern produces excess returns, automated algorithms and other market participants quickly spot it. As more capital flows into the same setup, the profit margin shrinks, and the alpha steadily decays toward zero.
To protect your capital against false signals and strategy decay, you must keep position sizes aligned with your statistical edge. Many systematic traders use the Kelly criterion to calculate the mathematically sound percentage of capital to risk on each trade based on win rate and payoff ratio, preventing oversized bets from erasing accumulated gains.
Finally, avoid the benchmark mismatch trap. If you trade volatile small-cap stocks or short-term derivatives, don't compare your performance to a cash deposit or a stable bond fund. Picking an artificially easy benchmark gives you an illusion of skill while hiding real downside risks.
Three Mistakes Traders Make When Chasing Alpha
Anyone asking "what is alpha in trading?" should also know how traders hurt their long-term results: by confusing broad market momentum for skill, taking excessive tail risk, and overtrading to force profits. Recognizing these patterns early keeps you from misreading your performance.
- Mistaking Bull Market Beta for Alpha: Rising tides lift all boats. When tech stocks surge 50% across the board, making 40% in your account doesn't prove you have an edge. It shows you held volatile assets during an uptrend. If that same portfolio drops 40% during the next market correction, your apparent alpha vanishes.
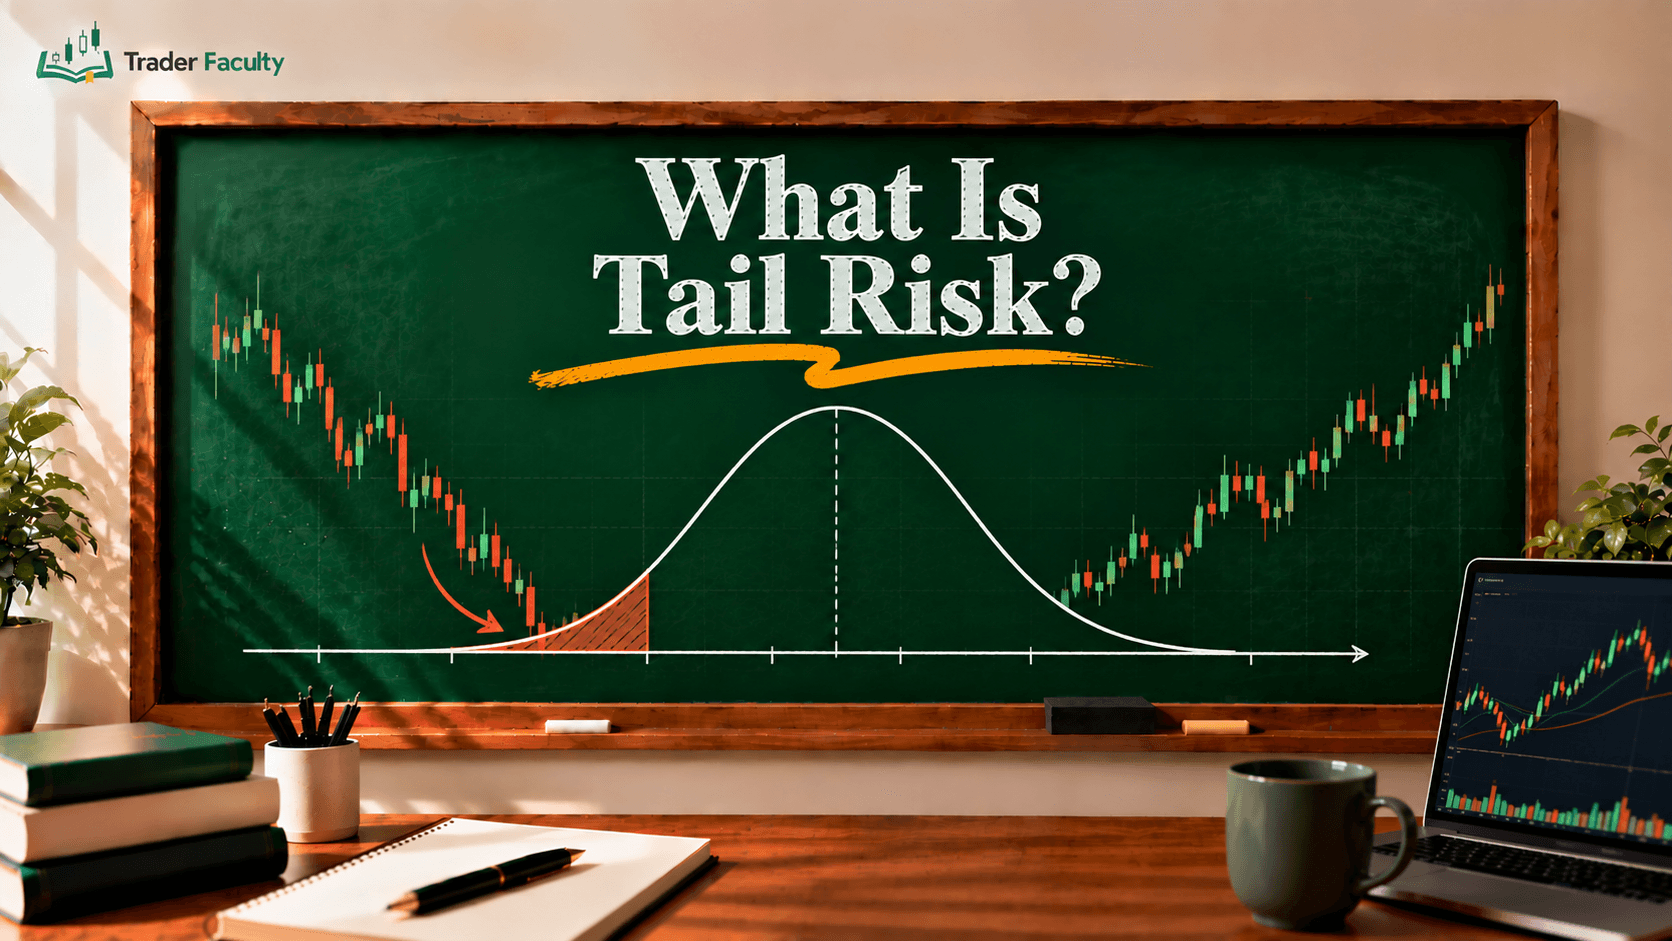
- Ignoring Drawdowns and Tail Risk: Some strategies generate steady positive returns for months by averaging down into losing positions or selling unhedged options. These systems look like reliable alpha engines until a sudden shock causes a severe drawdown. If your excess return depends on ignoring catastrophic downside risk, it isn't alpha; it's unmanaged danger.
- Overtrading to Force an Edge: When traders feel their returns slowing, they often take marginal setups to force more profit. Every extra trade brings new spread costs, execution risk, and mental fatigue. Forcing trades often turns positive gross alpha into deep negative net alpha.
Conclusion
So, what is alpha in trading? It's the measurable edge your process adds beyond the market, and understanding it shifts your focus from chasing vanity profits to building a disciplined, measurable trading process. It forces you to evaluate whether your time, effort, and capital risk are truly producing returns that passive index investing can't match.
Treating alpha as a diagnostic metric is a cornerstone of sound risk management. By benchmarking your portfolio honestly and accounting for every trading cost, you can objectively tell whether your strategy works or whether it needs structural adjustments.
Trading always carries the risk of losing money and underperforming broad market indices, so view alpha as an educational guide to evaluate your decisions rather than a promise of future gains.
Frequently Asked Questions
What is considered a good alpha in trading?
A good alpha is any consistently positive number above zero after deducting all trading fees, borrowing costs, and execution slippage. In institutional investing and active retail trading, generating an annualized alpha of 2% to 3% above a benchmark index is often considered strong performance. Over multi-year horizons, sustaining even a modest positive alpha is rare and indicates disciplined execution.
Can a trading strategy show positive profit but negative alpha?
Yes. If your trading account gains 8% during a year when the broader benchmark gains 12% with similar volatility, your active decisions produced negative 4% alpha. While your account balance grew, your active management lagged a simple passive fund. You took on active trading effort, stress, and operational costs only to underperform the baseline market.
How do active traders generate true alpha?
Some active traders aim to generate alpha by exploiting market inefficiencies through superior trade timing, specialized asset selection, or structural arbitrage. This includes trading off temporary price dislocations, using disciplined momentum breakouts, or capitalizing on volatility mispricings. Lasting alpha also relies heavily on strict position sizing and loss containment to ensure profits exceed market drawdowns over time.
What is the difference between gross alpha and net alpha?
Gross alpha measures your excess returns before deducting any transactional expenses or operational overhead. Net alpha reflects what remains in your account after paying broker commissions, financing margin rates, bid-ask spread friction, and order slippage. Because high-frequency and day trading incur frequent transaction costs, strategies that display positive gross alpha often yield negative net alpha in practice.
Does a high win rate guarantee positive alpha?
No. A trader can win 80% of their trades and still produce negative alpha if their average loss far exceeds their average gain. Alpha measures total risk-adjusted return relative to a benchmark, not trade frequency or win percentage. If a few large drawdowns erase accumulated profits, the overall strategy will fail to outperform the market hurdle.
Keep learning
Risk & Money Management
One good article won't save your account. A risk framework will.
7 lessons quiz
Start the courseThe Trader Faculty Team writes and reviews every guide together — pairing hands-on market experience with a curriculum-first approach to trading education. One good syllabus, taught in the order that makes you better.