What Is EV/EBITDA? Enterprise Value Multiples
Learn how to calculate EV/EBITDA and use enterprise value multiples to evaluate debt-heavy stocks. Read the full guide.
By Trader Faculty Team
Direct Answer
The EV/EBITDA ratio compares a company's total enterprise value (market cap plus debt minus cash) to its earnings before interest, taxes, depreciation, and amortization. It measures how many times operating earnings you pay to purchase the entire enterprise. Traders use EV/EBITDA to evaluate capital-intensive businesses regardless of their underlying debt structures.
An EV/EBITDA ratio (Enterprise Value to Earnings Before Interest, Taxes, Depreciation, and Amortization) compares a company's total valuation to its core operating cash profit. It measures how many times its operating earnings you are paying to buy the entire business.
Traders often rely on simple price multiples like the Price-to-Earnings (P/E) ratio, but those metrics obscure the risk of heavy corporate debt. EV/EBITDA provides a capital-structure-neutral view of valuation, making it essential for comparing debt-heavy companies or evaluating potential corporate takeovers.
Quick Takeaways
- EV/EBITDA evaluates corporate valuation regardless of a company's debt or equity financing mix.
- Enterprise Value includes market cap, debt, and preferred equity while subtracting total cash.
- EBITDA serves as a proxy for operational cash flow before non-cash expenses and capital structure choices.
- A low EV/EBITDA multiple can signal an undervalued target or a value trap burdened by large capital expenditure needs.
What Is EV/EBITDA?
The EV/EBITDA multiple is a fundamental valuation ratio used to measure a company's total enterprise value relative to its annual operating profitability. Institutional investors use this ratio to compare businesses with different financial structures, tax liabilities, and capital spending requirements.
To understand the combined ratio, you must break down its two components:
- Enterprise Value (EV): The total theoretical price tag to buy an entire company outright. Unlike market capitalization, EV accounts for both equity value and corporate debt while deducting liquid cash reserves.
- EBITDA: An acronym for Earnings Before Interest, Taxes, Depreciation, and Amortization. This figure strips out non-operating cash expenses, tax differences, and debt funding costs to focus purely on core business operations.
When you look at financial ratios, equity-only measures can hide structural leverage. By using Enterprise Value instead of share price alone, EV/EBITDA reveals what a business actually costs relative to the operational cash flow it generates.
How to Calculate EV/EBITDA Step-by-Step
Calculating EV/EBITDA requires pulling figures from both the balance sheet and the income statement. You first determine total Enterprise Value, then calculate EBITDA, and divide the former by the latter.
Step 1: Calculate Enterprise Value (EV)
Enterprise Value accounts for all claims on a company’s cash flows, including debt holders and equity owners.
Enterprise Value = Market Capitalization + Total Debt + Preferred Stock - Cash and Cash Equivalents
- Market Capitalization: Total outstanding shares multiplied by current share price.
- Total Debt: Sum of short-term interest-bearing debt and long-term debt liabilities.
- Cash and Cash Equivalents: Highly liquid reserves that an acquirer could immediately use to pay down debt.
Step 2: Calculate EBITDA
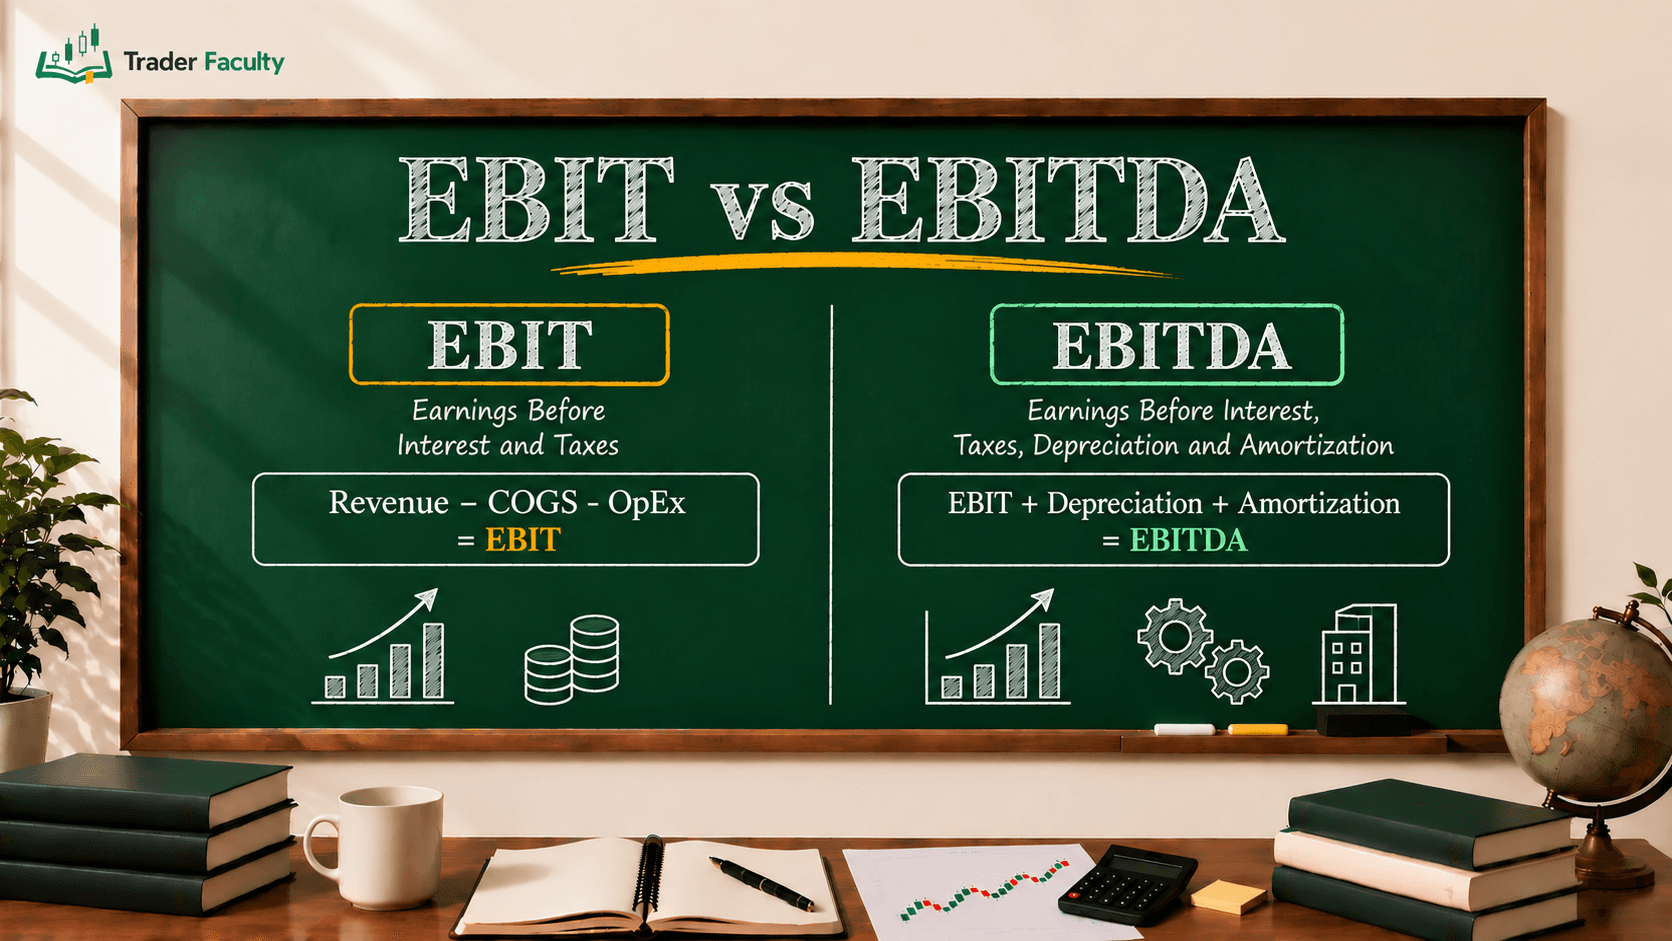
Start with operating profit (EBIT) on the income statement and add back non-cash charges.
EBITDA = Operating Income (EBIT) + Depreciation Expense + Amortization Expense
- Depreciation: Non-cash expense allocating the historical cost of tangible fixed assets (machinery, property) over their useful lives.
- Amortization: Non-cash expense writing off intangible assets (patents, software, trademarks) over time.
Step 3: Divide EV by EBITDA
Divide the total Enterprise Value by the annual EBITDA figure to get the final multiple.
EV/EBITDA = Enterprise Value / EBITDA
Worked Hypothetical Calculation
Consider two hypothetical competing industrial firms, Company A and Company B, operating in the same market sector:
| Financial Metric | Company A (Equity Funded) | Company B (Debt Heavy) |
|---|---|---|
| Share Price | $50.00 | $20.00 |
| Shares Outstanding | 10 Million | 10 Million |
| Market Capitalization | $500 Million | $200 Million |
| Total Debt | $50 Million | $350 Million |
| Cash & Equivalents | $50 Million | $50 Million |
| Enterprise Value (EV) | $500 Million | $500 Million |
| Operating Income (EBIT) | $40 Million | $40 Million |
| Depreciation & Amortization | $10 Million | $10 Million |
| EBITDA | $50 Million | $50 Million |
| EV/EBITDA Multiple | 10.0x | 10.0x |
Company A and Company B carry identical Enterprise Values ($500M) and identical EBITDA figures ($50M), yielding an identical 10.0x EV/EBITDA ratio. However, a trader looking only at market capitalization or share price would mistakenly view Company B as far cheaper than Company A.
EV/EBITDA vs. P/E Ratio: Key Differences
The primary distinction between EV/EBITDA and the Price-to-Earnings (P/E) ratio lies in capital structure neutrality. The P/E ratio focuses solely on net income available to equity holders, which is reduced by interest payments on corporate debt. EV/EBITDA measures total firm value against operating cash flows before debt payments are deducted.
| Valuation Feature | EV/EBITDA Ratio | Price-to-Earnings (P/E) Ratio |
|---|---|---|
| Valuation Scope | Total Firm Value (Equity + Debt) | Equity Value Only (Market Cap) |
| Denominator Metric | EBITDA (Pre-interest operating earnings) | Net Income (Post-interest earnings) |
| Capital Structure Neutral | Yes (Unaffected by debt-to-equity choices) | No (Distorted by leverage and interest expense) |
| Non-Cash Expense Impact | Adds back Depreciation & Amortization | Reduced by Depreciation & Amortization |
| Primary Sector Fit | Capital-intensive, debt-heavy industries | Asset-light, stable profitable sectors |
Because interest payments reduce net income, a leveraged business can appear to have an artificially distorted P/E ratio. EV/EBITDA eliminates this distortion by assessing the operating engine of the enterprise before capital structure decisions take effect.
How Traders Use EV/EBITDA in Fundamental Valuation
Fundamental traders use EV/EBITDA to evaluate valuation relative to historical averages, industry peers, and corporate acquisition standards.
1. Peer-to-Peer Industry Valuation
Multiples vary significantly by industry. Asset-heavy sectors like telecommunications, utilities, and manufacturing typically carry lower baseline EV/EBITDA multiples, while high-growth software firms trade at higher multiples.
Comparing a stock's current multiple against its direct sector peer group helps highlight relative valuation gaps.
2. Identifying M&A Takeover Candidates
Merger and acquisition (M&A) analysts lean heavily on EV/EBITDA because a buyer acquiring a company must assume its net debt. If an enterprise trades at a low multiple relative to peers, an acquirer could buy the company, restructure its balance sheet, and use its operating EBITDA to pay off corporate debt.
3. Evaluating Profitability Alongside Operating Margins
A low EV/EBITDA multiple is most meaningful when paired with healthy core profitability. Assessing a company's gross margin alongside its EV/EBITDA ratio helps verify that low operating multiples stem from temporary market mispricing rather than structural operational decay.
Common Traps & Limitations of EV/EBITDA
While EV/EBITDA is a powerful comparative tool, relying on it without examining secondary financial statements exposes traders to several fundamental blind spots.
The Capital Expenditure (CapEx) Blind Spot
EBITDA adds back depreciation and amortization, completely ignoring ongoing capital expenditure (CapEx) costs. For companies that must constantly replace expensive physical infrastructure—such as airlines, telecom providers, or semiconductor foundries—EBITDA overstates available cash flow.
If Company X and Company Y both generate $100 Million in EBITDA, but Company X must reinvest $80 Million annually in equipment replacement while Company Y reinvests $10 Million, Company X has significantly lower real cash generation despite having the same EV/EBITDA multiple.
The Value Trap
A low EV/EBITDA multiple does not automatically mean a stock is undervalued. Distress factors that lower multiples include:
- Cyclical business peaks where current earnings are unsustainable.
- Imminent debt maturity walls that threaten corporate liquidity.
- Loss of major corporate customers or core revenue sources.
Lease Expense Capitalization (IFRS 16 / ASC 842)
Accounting standards require operating leases (e.g., retail store leases, aircraft leases) to be capitalized on the balance sheet as right-of-use assets and corresponding lease liabilities. This rule shifts lease expenses out of operating costs and into depreciation and interest, artificially boosting reported EBITDA. Always verify whether reported multiples account for normalized lease adjustments.
Financial Sector Exclusion
EV/EBITDA cannot be used to evaluate banks, insurance companies, or financial brokerages. For financial institutions, debt is not a capital structure choice; it represents operating inventory (deposits used to fund loans). Additionally, operating income for banks is derived directly from net interest margin, rendering interest-excluded metrics like EBITDA meaningless.
Conclusion
Understanding the EV/EBITDA meaning allows traders to bypass equity-only distortions and evaluate businesses on a debt-neutral basis. By combining Enterprise Value with operating cash flow proxies, this metric offers a clearer valuation picture for capital-intensive firms and corporate acquisition targets.
However, no single valuation multiple guarantees trading performance. Low EV/EBITDA multiples must always be verified against real capital expenditures, balance sheet solvency, and long-term operating margins.
Trading financial markets involves a genuine risk of capital loss. Always treat fundamental ratio analysis as an educational framework for evaluating company performance rather than direct investment advice.
Frequently Asked Questions
What is EV/EBITDA meaning in fundamental analysis?
EV/EBITDA measures a company's total valuation against its core operating profitability. It evaluates how many times annual operating earnings you pay to acquire the firm outright, accounting for both equity and corporate debt.
How do you calculate EV/EBITDA step-by-step?
First, calculate Enterprise Value by adding market capitalization and total debt, then subtracting cash reserves. Next, calculate EBITDA by adding depreciation and amortization back to operating profit (EBIT). Finally, divide Enterprise Value by EBITDA.
Is a lower EV/EBITDA ratio always better?
A lower multiple can indicate an undervalued stock, but it can also flag a value trap. Companies facing high capital expenditure demands, loss of customers, or heavy debt maturity walls often trade at low multiples despite operating risks.
Why is EV/EBITDA preferred over the P/E ratio for debt-heavy companies?
The P/E ratio only evaluates equity value and is heavily affected by interest expenses. EV/EBITDA includes debt in the valuation numerator and evaluates operating income before interest payments, providing a capital-structure-neutral comparison across peer companies.
Why can't you use EV/EBITDA to value banks and financial stocks?
Financial institutions treat debt as operating inventory (customer deposits used to fund loans) rather than a balance sheet financing choice. Additionally, bank operating revenue comes directly from interest income, rendering interest-excluded metrics like EBITDA meaningless.
The Trader Faculty Team writes and reviews every guide together — pairing hands-on market experience with a curriculum-first approach to trading education. One good syllabus, taught in the order that makes you better.