Gross Profit Margin: How to Calculate and Analyze It
Learn what this metric is, how to calculate it using sales and direct production costs, and how to analyze margin trends. Read the full guide.
By Trader Faculty Team
Direct Answer
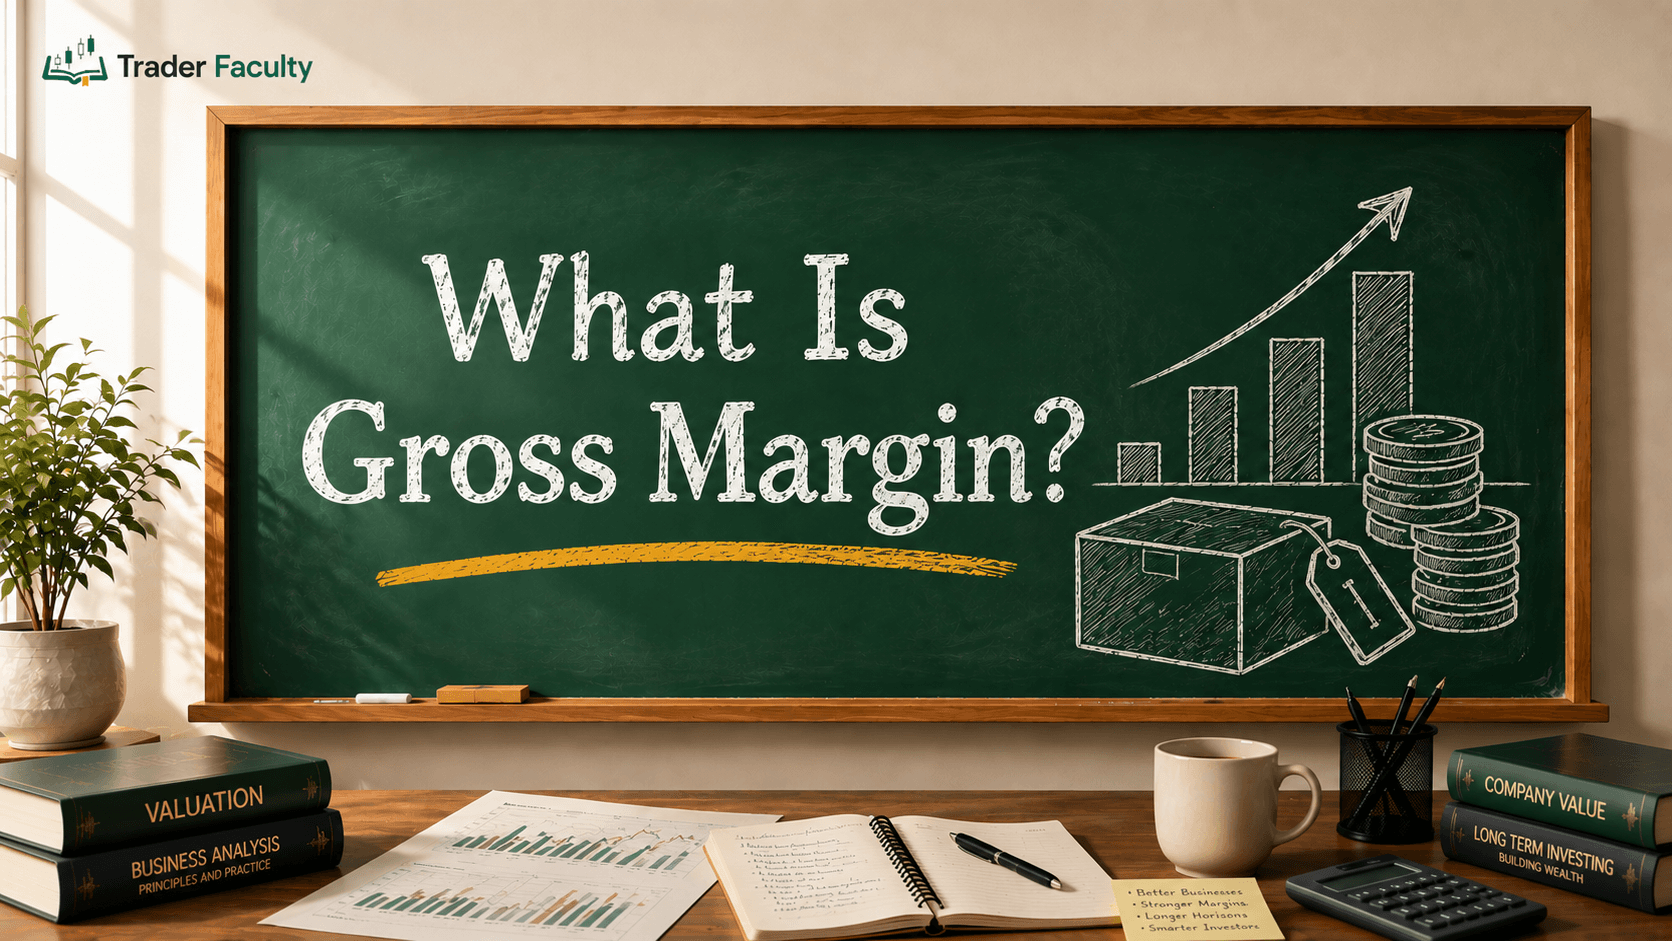
Gross profit margin is a financial ratio that measures the percentage of revenue remaining after deducting the direct costs of producing goods or services (Cost of Goods Sold). It is calculated by subtracting Cost of Goods Sold from total revenue, dividing the result by total revenue, and multiplying by 100. Traders use gross margin trends to evaluate a business's pricing power and operational efficiency over time.
This ratio is a fundamental financial metric that measures the percentage of revenue a company retains after paying the direct costs of producing its goods or services.
Many new traders look only at top-line revenue growth when evaluating a company, but growing sales can hide shrinking profitability. If production costs rise faster than revenue, a business may struggle even as its total sales increase.
This guide covers what this metric is, how to calculate it step-by-step, and how active traders use margin trends to evaluate corporate performance.
Quick Takeaways
- This ratio shows the percentage of sales revenue left over after covering direct production expenses.
- Expanding margins signal strong pricing power or efficient production, while narrowing ones point to cost inflation.
- Cost of goods sold (COGS) includes raw materials and direct labor, but excludes operating expenses like marketing, interest, and taxes.
- Comparing margins across different sectors can lead to wrong conclusions because business models have different cost structures.
What Is Gross Profit Margin?
It is an accounting metric that shows how efficiently a business converts raw materials, inventory, and labor into profitable products. Expressed as a percentage, it tells you how many cents of gross profit a company keeps from every dollar of revenue generated.
It's important you separate total gross profit from gross profit margin — they're not the same thing. Gross profit is an absolute dollar amount calculated by subtracting direct production costs from total revenue. It takes that dollar figure and divides it by total sales to create a standardized percentage. This percentage lets traders compare companies of different sizes on an equal basis.
The calculation relies on two core line items from the income statement:
- Net Sales (Revenue): The total money earned from selling goods or services, after subtracting returns, discounts, and allowances.
- Cost of Goods Sold (COGS): The direct costs required to create those goods or services.
Traders often compare this metric against gross margin to track operational consistency across sequential quarters.
How to Calculate Gross Profit Margin
Calculating this ratio requires taking the dollar amount of gross profit, dividing it by total net sales, and multiplying the result by 100.
Gross Profit Margin Formula = ((Revenue - Cost of Goods Sold) / Revenue) x 100
To use the formula correctly, you must know which expenses belong in Cost of Goods Sold and which belong in operating expenses.
COGS includes direct costs such as raw materials, direct manufacturing labor, factory utilities, and freight costs to ship inventory. It excludes indirect operating overhead such as office rent, sales salaries, marketing campaigns, legal fees, interest payments, and corporate taxes. Those indirect costs are accounted for lower on the income statement in operating margin and net profit margin calculations.
Step-by-Step Calculation Example
Consider two hypothetical companies in the retail sector to see how this works in practice:
- Company A: Generates $1,000,000 in net sales and reports $600,000 in COGS.
- Gross Profit = $1,000,000 - $600,000 = $400,000
- Gross Profit Margin = ($400,000 / $1,000,000) x 100 = 40%
- Company B: Generates $5,000,000 in net sales and reports $4,000,000 in COGS.
- Gross Profit = $5,000,000 - $4,000,000 = $1,000,000
- Gross Profit Margin = ($1,000,000 / $5,000,000) x 100 = 20%
Even though Company B generates more total dollar profit, Company A retains double the percentage of its sales after direct costs. Company A has a larger cushion to pay for research, debt service, and operational expansion.
If you prefer not to calculate by hand, a gross profit margin calculator can apply this formula instantly to your own revenue and COGS figures.
Why Gross Profit Margin Matters for Traders
For fundamental traders, this ratio is a primary test of a company's competitive advantage. According to corporate reporting guidelines established by the SEC, public companies must present revenue and cost of goods sold clearly on their periodic income statements, giving traders standardized data to track.
Tracking margin trends over four to eight quarters helps traders spot two critical market conditions:
1. Pricing Power and Inflation Resistance
When raw material prices or freight costs rise, high-margin companies can absorb the increases or pass cost hikes to customers without losing sales. Companies with low gross margins have little protection against cost inflation. A small increase in input costs can erase their remaining profit margin entirely.
2. Early Warning of Sales Divergence
A dangerous signal occurs when revenue rises while the gross margin contracts. This pattern often means management is cutting prices or offering steep discounts to maintain top-line growth. While overall sales numbers look strong on the surface, profitability per unit sold is falling, which often precedes disappointing earnings reports.
Industry Benchmarks and Cross-Sector Comparisons
There is no single "good" margin figure that applies to every business. What counts as an excellent margin in retail would indicate severe trouble for a software business.
According to industry margin data compiled by NYU Stern (Damodaran Online), typical gross margin ranges vary widely by sector:
| Sector | Average Gross Margin | Primary Cost Drivers |
|---|---|---|
| Software / SaaS | 70% – 90% | Cloud hosting, server infrastructure, customer onboarding |
| Pharmaceuticals | 65% – 85% | Chemical ingredients, specialized manufacturing, packaging |
| Retail & Apparel | 30% – 50% | Wholesale inventory purchasing, freight, store distribution |
| Automotive | 15% – 25% | Steel, electronics, assembly plant labor, supply logistics |
| Grocery Stores | 10% – 20% | Bulk food purchasing, spoilage, cold storage transport |
Software businesses enjoy high gross margins because duplicating software code costs almost nothing. Grocery stores operate on thin margins because food distribution involves physical transport, storage, and perishability.
Because of these structural differences, you should compare a company's margin only against its direct industry competitors or against its own historical baseline.
Common Mistakes When Analyzing Gross Margin
Evaluating profit margins requires avoiding three common analytical errors:
Mistake 1: Confusing Gross Margin with Net Margin
This metric looks only at direct production costs. It ignores administrative salaries, marketing expense, interest on corporate debt, and taxes. A company can post an impressive 70% margin and still run a net loss if its overhead costs or debt payments are too high.
Mistake 2: Treating High Margin as an Automatic Buy Signal
A broad financial evaluation framework, such as the standards outlined by the CFA Institute, requires examining liquidity, leverage, and cash flow alongside margins. A company with an 80% margin may still face declining market share, high litigation risks, or poor capital management.
Mistake 3: Overlooking Temporary Inventory Write-Downs
This ratio can fluctuate significantly in a single quarter due to temporary inventory adjustments or supply chain disruptions. Always look at multi-quarter trends rather than isolated quarterly spikes to judge long-term health.
Conclusion
This metric provides fundamental traders with a clear view of operational performance by stripping away non-production expenses. Tracking margin trends across sequential earnings reports highlights whether a company holds genuine pricing power or is losing ground to rising production costs.
To put this metric into practice, evaluate margin figures alongside broader financial ratios to build a complete picture of corporate health. Trading financial markets involves real risk of loss, so use margin analysis as one tool within a disciplined research strategy.
Frequently Asked Questions
What is a good gross profit margin?
This depends heavily on the industry. High-tech and software companies often report gross margins between 70% and 90%, whereas retail or grocery businesses typically operate with margins between 10% and 30%. A healthy margin is one that aligns with or exceeds direct industry peers.
What is the difference between gross profit margin and net profit margin?
It measures earnings left over after deducting only direct production costs (COGS). Net profit margin measures total profitability after subtracting all business costs, including administrative expenses, sales and marketing, interest, taxes, and operational overhead.
Can gross profit margin be higher than 100%?
No, it cannot exceed 100% under standard accounting practices. Since Cost of Goods Sold cannot be negative, gross profit will never be greater than total sales revenue.
What causes gross profit margin to decrease?
It decreases when input costs—such as raw materials, direct labor, or freight—rise faster than sales prices. It also contracts when a company offers aggressive price discounts to clear excess inventory.
Why is revenue growing while gross profit margin is falling?
This divergence occurs when a company relies on heavy discounting or price cuts to boost top-line revenue volume. While total sales look strong, profitability per unit sold declines, which can warn of upcoming earnings pressure.
The Trader Faculty Team writes and reviews every guide together — pairing hands-on market experience with a curriculum-first approach to trading education. One good syllabus, taught in the order that makes you better.