Debt to EBITDA Ratio: Definition, Formula, and Benchmarks
Learn how to calculate the debt to EBITDA ratio and interpret corporate leverage benchmarks. Read the full guide.
By Trader Faculty Team
Direct Answer
The debt to EBITDA ratio is a financial leverage metric measuring how many years of operating cash flow a business requires to repay its total debt. Calculated by dividing total debt by Earnings Before Interest, Taxes, Depreciation, and Amortization (EBITDA), lower ratios indicate stronger debt coverage, while values exceeding 4.0x or 5.0x signal elevated credit risk.
The debt to EBITDA ratio measures how many years of operating earnings a business needs to pay back its total debt. It shows a company's debt burden relative to its cash-generating ability before non-cash expenses.
Many stock traders focus on revenue growth, only to get caught by surprise when a heavily indebted company runs into trouble during interest rate spikes. Tracking corporate debt metrics keeps you from buying businesses that carry too much debt. This guide explains how the ratio works, how to calculate gross and net debt versions, and what values alert fundamental traders to credit risk.
Quick Takeaways
- The debt to EBITDA ratio indicates how many years a company needs to pay off its debt assuming constant cash flow.
- Lower ratios generally reflect stronger debt coverage, while ratios above 4.0x or 5.0x signal higher credit risk.
- Net debt to EBITDA subtracts cash reserves from total debt, giving a clearer picture for cash-rich companies.
- Capital-intensive sectors like utilities run higher leverage benchmarks than asset-light technology firms.
- Fundamental traders use this metric to spot potential credit downgrades and dividend cuts before they hit stock prices.
Debt to EBITDA Ratio Meaning: What Is Debt to EBITDA Ratio?
Understanding what is debt to ebitda ratio analysis starts with looking at how companies fund their business operations. Corporate managers often borrow money through bank loans or corporate bonds to build new factories, buy equipment, or launch products. However, taking on debt adds fixed interest payments that the business must meet regardless of market conditions.
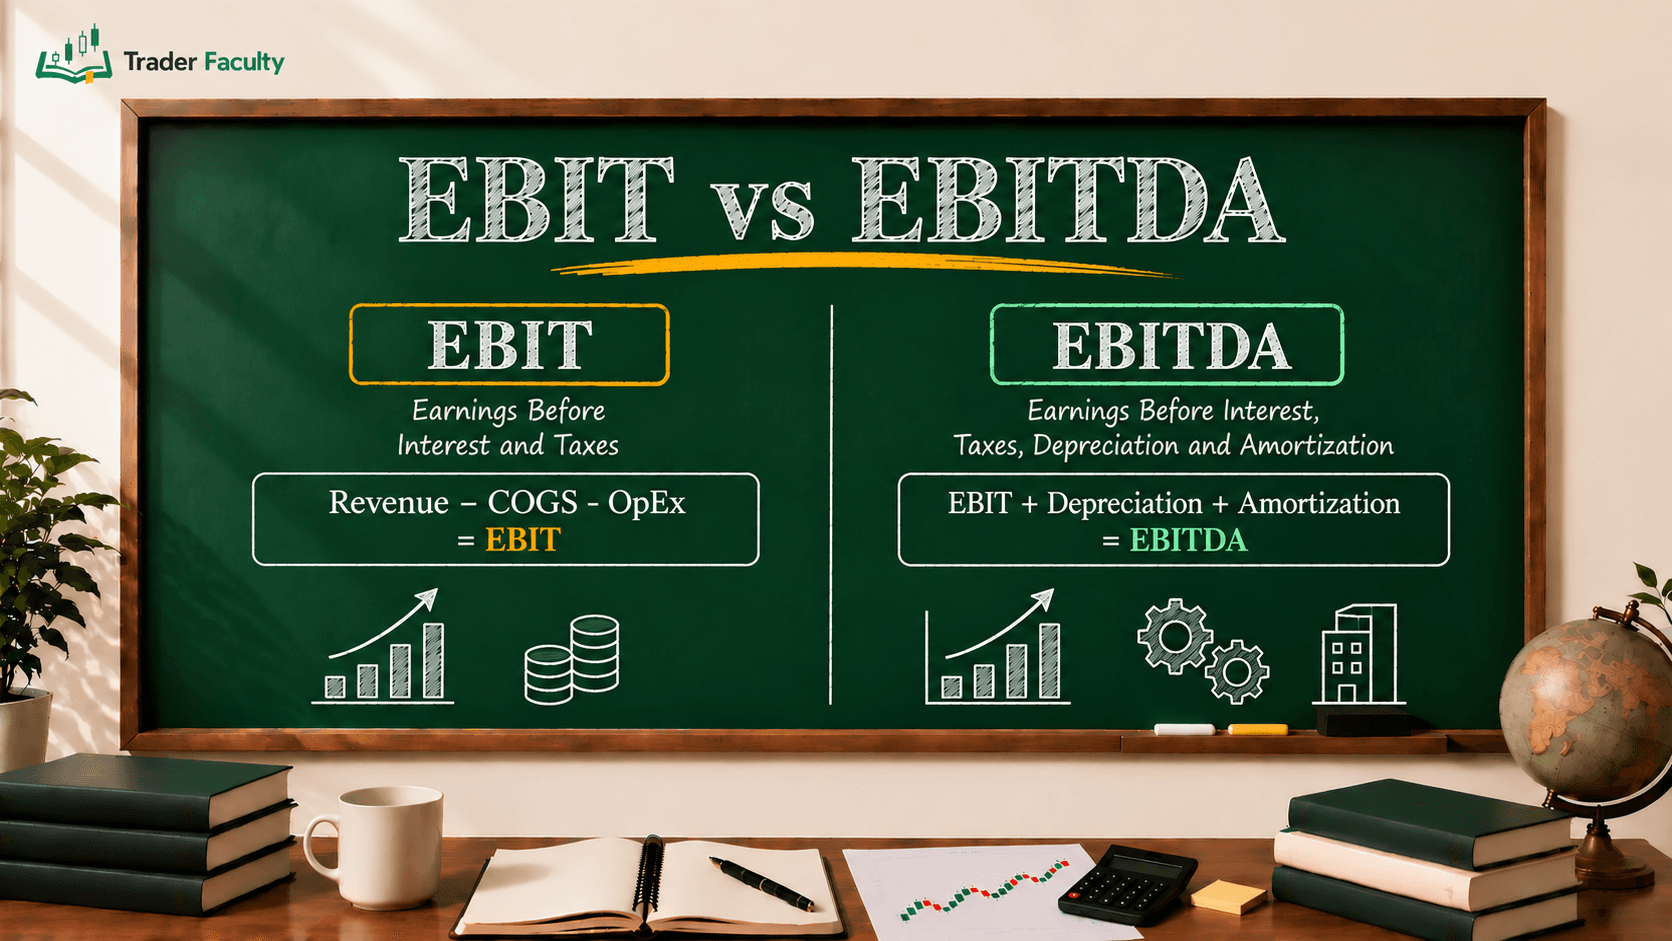
The debt to ebitda ratio meaning centers on debt coverage. EBITDA stands for Earnings Before Interest, Taxes, Depreciation, and Amortization. It serves as a rough proxy for operating cash flow — that is, cash generated from day-to-day business actions — before accounting for capital structure and tax laws. By comparing total liabilities to earnings, the metric answers a basic question: if cash flows stay constant and all earnings go toward debt repayment, how long will debt clearance take?
Unlike simple debt-to-equity ratios that rely on book value, this indicator links debt levels to actual earnings capacity. When economic growth slows down, companies with low earnings relative to debt obligations struggle to refinance loans, putting pressure on share prices.
How to Calculate Debt to EBITDA Ratio: Step-by-Step Formula

Learning how to calculate debt to ebitda ratio values requires pulling numbers from two parts of a corporate earnings report: the balance sheet and the income statement.
The basic formula uses gross debt:
Debt to EBITDA Ratio = Total Debt / EBITDA
Where:
- Total Debt is the sum of short-term debt, long-term debt, and interest-bearing notes on the balance sheet.
- EBITDA is operating profit plus non-cash expenses (depreciation and amortization) on the income statement.
Many financial analysts prefer using net debt instead of total debt. Net debt subtracts cash and cash equivalents from total borrowing:
Net Debt to EBITDA Ratio = (Total Debt - Cash & Cash Equivalents) / EBITDA
Subtracting cash matters because a firm with $500 million in debt and $400 million in cash has a net debt burden of only $100 million.
Let's look at a calculation example comparing two hypothetical companies:
| Financial Metric | Company A (Industrial) | Company B (Software) |
|---|---|---|
| Short-Term Debt | $50 million | $10 million |
| Long-Term Debt | $350 million | $40 million |
| Total Debt | $400 million | $50 million |
| Cash & Cash Equivalents | $50 million | $30 million |
| Net Debt | $350 million | $20 million |
| Annual EBITDA | $100 million | $25 million |
| Gross Debt to EBITDA | 4.0x | 2.0x |
| Net Debt to EBITDA | 3.5x | 0.8x |
In this scenario, Company A needs 4.0 years of operating earnings to clear its debt load, whereas Company B requires only 2.0 years (or 0.8 years if using cash reserves).
Industry Benchmarks: What Is a Healthy Leverage Ratio?
There is no single debt ratio that fits every stock. A healthy metric depends on business stability, cash predictability, and industry norms. Credit rating agencies such as S&P Global and Moody's commonly factor leverage ratios like this into their corporate credit assessments, though exact thresholds vary by methodology and sector.
- Below 2.0x (Low Leverage): Indicates conservative balance sheet management and high debt coverage. Common in high-margin technology and pharmaceutical firms.
- 2.0x to 3.5x (Moderate Leverage): Typical for standard industrial businesses. Generally acceptable for investment-grade corporate credit ratings.
- 3.5x to 5.0x (Elevated Risk): Suggests heavy debt loads. Often tolerated in regulated utilities or real estate where revenues remain steady during recessions.
- Above 5.0x (High Risk / Junk Rating): Flags elevated insolvency risk and potential credit downgrades. Frequently seen in leveraged buyouts or distressed companies.
Sector context is essential. Capital-intensive businesses like telecom operators build expensive networks, taking on large long-term liabilities. They can safely sustain a 4.0x ratio because customer subscriptions produce stable monthly revenue. In contrast, cyclical businesses like auto makers or semiconductor producers see sharp profit declines during economic downturns. For cyclical stocks, a 4.0x leverage ratio during peak earnings can quickly expand to 8.0x during a downturn, threatening company solvency.
Why Leverage Metrics Matter for Fundamental Traders
Fundamental traders analyze leverage ratios to protect capital against unexpected credit events. When corporate borrowing costs rise, companies with high debt loads see interest expense eat away at their profit margins.
Before looking at debt coverage, traders evaluate profitability metrics like gross margin to see how much revenue remains after direct production costs. A business with healthy gross margins has a wider cushion to absorb rising interest payments. Conversely, a company combining weak margins with high debt risks severe earnings contraction when debt comes due.
The financial standard for credit evaluation defined by the CFA Institute highlights how credit analysts use debt coverage to predict corporate bond downgrades. When debt to EBITDA climbs above bank loan agreement limits — known as debt covenants — lenders can demand immediate repayment or raise interest rates. These events trigger institutional sell-offs, driving down stock prices.
Common Mistakes When Analyzing Debt to EBITDA
While EBITDA ratios offer a quick way to gauge corporate borrowing, fundamental analysts watch for three frequent analytical traps:
- Treating EBITDA as Pure Cash Flow: EBITDA adds back depreciation and amortization, but it ignores capital expenditures — cash spent to maintain or replace property, plant, and equipment. A manufacturing company may show strong EBITDA while spending every dollar of operating profit on new machinery to stay operational.
- Ignoring Off-Balance-Sheet Liabilities: Standard total debt figures sometimes exclude operating leases, unfunded pension liabilities, or short-term debt spikes. Always examine total debt notes in quarterly financial reports.
- Overlooking Working Capital Requirements: EBITDA does not account for changes in working capital, such as cash tied up in unsold inventory or unpaid customer bills. A business can report high EBITDA earnings on paper while suffering cash shortfalls.
Conclusion
The debt to EBITDA metric provides stock traders with a clear view of corporate leverage and financial risk. By comparing total debt and net debt against operating earnings, you can identify companies with comfortable debt coverage and spot those heading toward potential default or debt covenant breaches. Combining this metric with profitability indicators helps you build a strong stock evaluation process.
To deepen your stock screening skills, review our broader guide on financial ratios to learn how debt metrics work alongside liquidity and valuation tools.
Trading stocks carries the risk of losing capital, so treat fundamental analysis metrics as educational tools rather than single signals for making investment decisions.
Frequently Asked Questions
What is a good debt to EBITDA ratio?
A debt to EBITDA ratio below 3.0x is generally considered healthy for most industrial companies, indicating manageable leverage. Ratios between 3.0x and 4.0x represent moderate debt, while ratios exceeding 4.0x or 5.0x often signal high leverage and credit risk, though capital-intensive sectors like utilities safely operate at higher levels.
What is the difference between gross debt to EBITDA and net debt to EBITDA?
Gross debt to EBITDA divides total borrowing by operating earnings without accounting for cash balances. Net debt to EBITDA subtracts cash and cash equivalents from total debt before dividing by EBITDA, offering a clearer look at net debt burden for cash-rich businesses that could immediately pay down liabilities.
Why do analysts use EBITDA instead of net income for debt ratios?
Analysts use EBITDA because it reflects core operating cash generation before accounting for capital structure, local tax regimes, and non-cash expenses like depreciation. This provides a standardized baseline to compare debt coverage across companies with different tax rates and capital spending structures.
What happens when a company's debt to EBITDA ratio gets too high?
When a company's leverage ratio climbs too high, credit rating agencies may downgrade its corporate debt, increasing borrowing costs. If the ratio breaches bank loan covenants, lenders can demand immediate repayment or raise interest rates, which often forces dividend cuts, asset sales, or share dilution.
Does a low debt to EBITDA ratio always mean a stock is safe?
Not necessarily. While a low ratio shows strong immediate debt coverage, it does not account for heavy future capital expenditure requirements or working capital shortages. Conservative leverage alone does not guarantee stock price appreciation if operating margins or business revenues deteriorate.
The Trader Faculty Team writes and reviews every guide together — pairing hands-on market experience with a curriculum-first approach to trading education. One good syllabus, taught in the order that makes you better.