What Are Financial Ratios? A Trader Guide
Learn what financial ratios are, the 5 main categories, and how to evaluate financial statements. Read the full guide.
By Trader Faculty Team
Direct Answer
Financial ratios are quantitative metrics calculated by comparing line items from corporate balance sheets, income statements, and cash flow statements. They allow traders and investors to standardize financial data, compare companies of different sizes, and evaluate corporate profitability, liquidity, solvency, and valuation.
Financial ratios are quantitative metrics calculated by comparing specific line items from a company's financial statements, including its income statement, balance sheet, and cash flow statement.
Many new traders look at stock prices or earnings totals in isolation, making it difficult to determine whether a company is performing well or trading at a fair price. Ratio analysis solves this problem by normalizing accounting data, allowing you to compare companies of completely different sizes, evaluate management performance, and spot financial risks before placing a trade. This guide covers the five primary financial ratio categories, key metrics in each group, and how fundamental traders synthesize them to evaluate public companies.
Quick Takeaways
- Financial ratios turn raw accounting data into standardized percentages and multiples for accurate company comparisons.
- Evaluating liquidity and leverage ratios protects traders from unexpected corporate insolvency or debt distress.
- Profitability metrics show how efficiently management converts revenue and corporate assets into net bottom-line earnings.
- Valuation multiples compare market stock prices against corporate book accounting values to highlight overvalued or undervalued stocks.
- Ratio analysis must always account for broad industry norms and economic cycles rather than relying on fixed cutoff numbers.
Liquidity and Short-Term Solvency Ratios

Liquidity ratios evaluate a company's ability to settle short-term obligations using its most liquid assets without raising external capital or selling fixed production equipment.
For stock traders, liquidity metrics serve as an early warning system. When a company faces a sudden drop in sales or an economic slowdown, strong liquidity provides a cushion. Conversely, weak liquidity often forces companies to issue sudden stock offerings, diluting existing shareholders and driving share prices lower.
Short-Term Asset Coverage
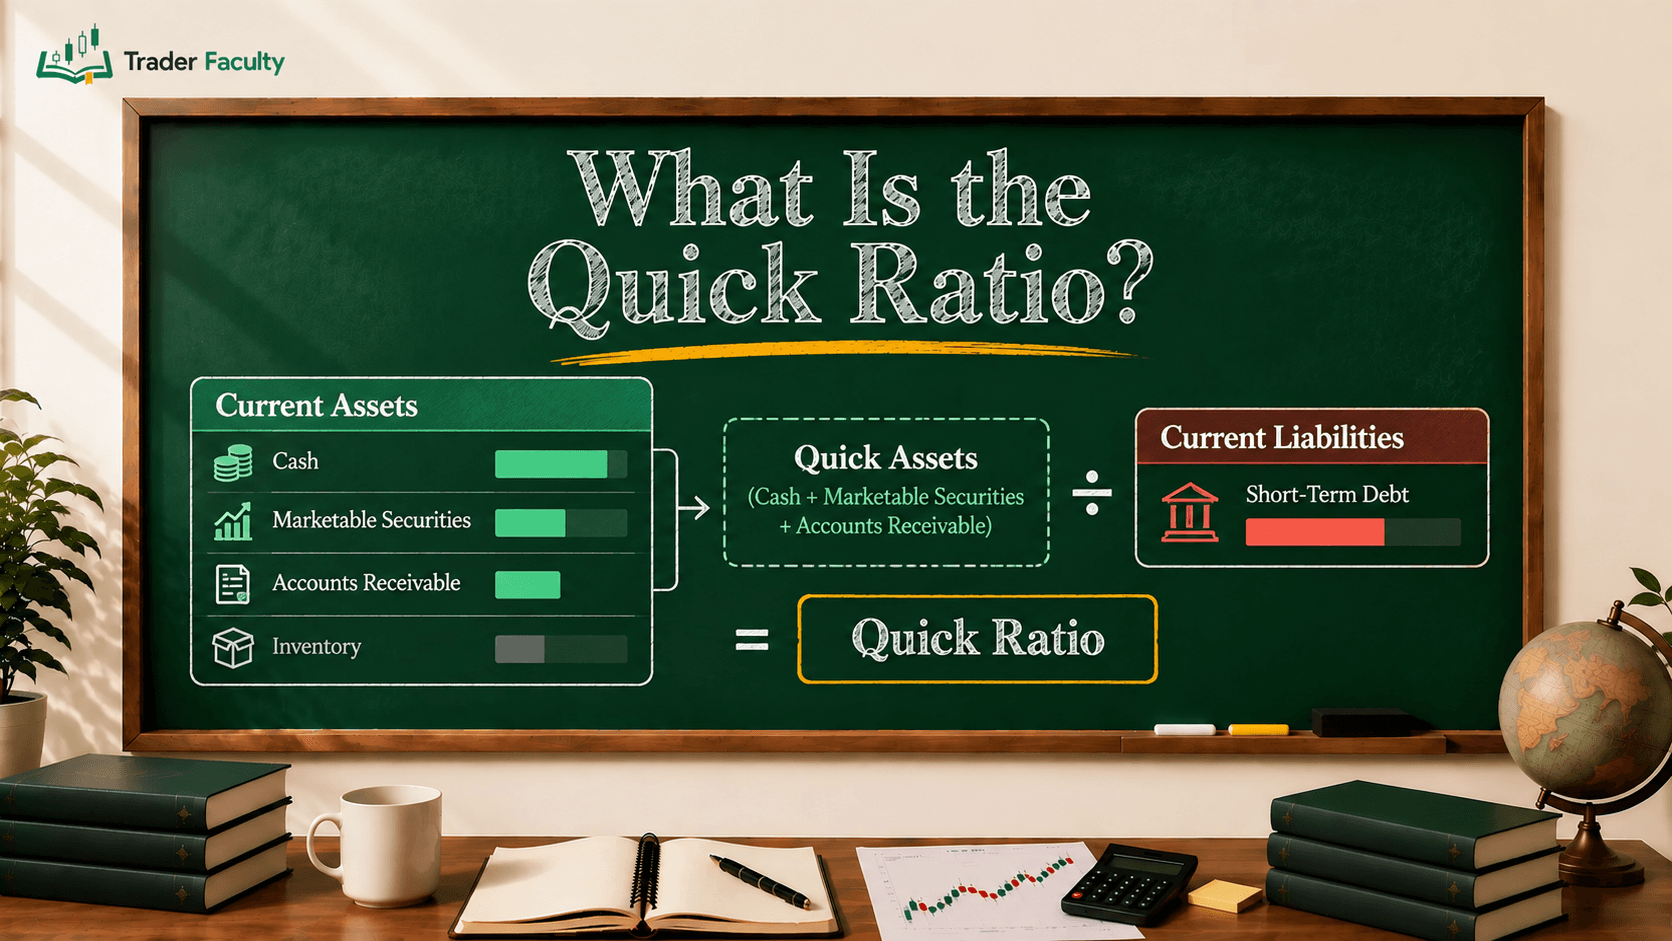
Short-term asset coverage metrics measure how easily current assets—such as cash, short-term investments, and accounts receivable—can cover obligations due within one year.
Traders track the current ratio to compare short-term assets against liabilities. A ratio above 1.0 indicates that a company holds more immediate assets than immediate debts. However, if a large portion of those current assets is tied up in slow-moving inventory, the metric can look healthier than it actually is. In those cases, stricter tests strip out inventory to measure immediate debt-paying ability.
Liquid Capital Reserves
Liquid capital metrics look beyond simple coverage to evaluate the raw dollar buffer available to run daily operations smoothly.
Monitoring working capital shows the operating capital remaining after subtracting short-term liabilities from short-term assets. Positive operating capital ensures a business can buy inventory, pay employee wages, and handle unexpected costs without relying on high-interest loans. Active traders avoid companies with shrinking operating capital because funding gaps usually lead to financial distress.
Profitability and Operating Efficiency Metrics
Profitability ratios measure how effectively a company converts its top-line sales revenue into operational profits and net income for equity investors.
While top-line revenue growth attracts news headlines, profitability determines whether that growth is sustainable. High margins show that a company holds strong pricing power over competitors, while strong return metrics prove that corporate management uses shareholder capital wisely.
Production and Operating Efficiency
Production and operating efficiency metrics measure how much profit a business retains at each stage of its income statement, from raw manufacturing down to core business operations.
Traders review gross margin to see how much revenue remains after deducting direct production and manufacturing costs. An expanding percentage indicates strong pricing power or falling cost of goods sold.
To assess profitability after accounting for sales, administration, and marketing overhead, traders look at operating margin. This reveals how efficiently core operational teams manage day-to-day costs.
Finally, the net profit margin measures the ultimate bottom-line percentage retained from every dollar of sales after paying all taxes, interest, and operating expenses.
Return on Capital and Operational Proxies
Return metrics and cash proxies evaluate management efficiency by comparing earnings against the assets and equity invested in the firm.
- Return on equity: Measures the net profit generated for every dollar of shareholder equity, highlighting management's ability to grow equity value.
- Return on assets: Displays how efficiently a firm uses its total asset base to produce net earnings, regardless of its capital structure.
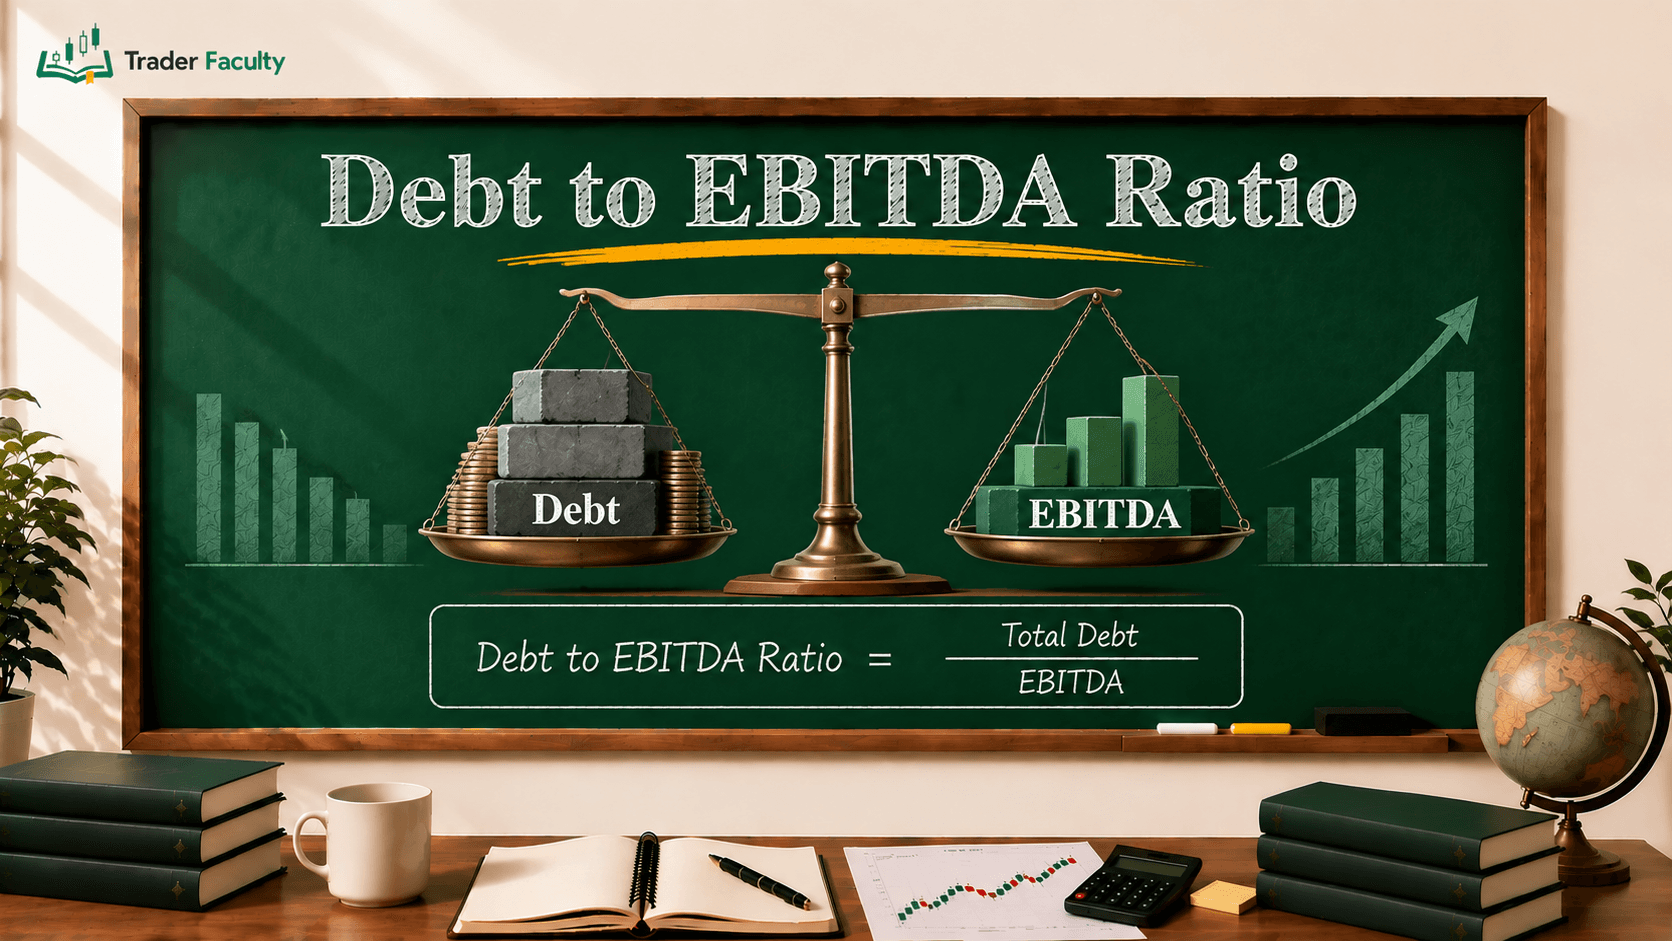
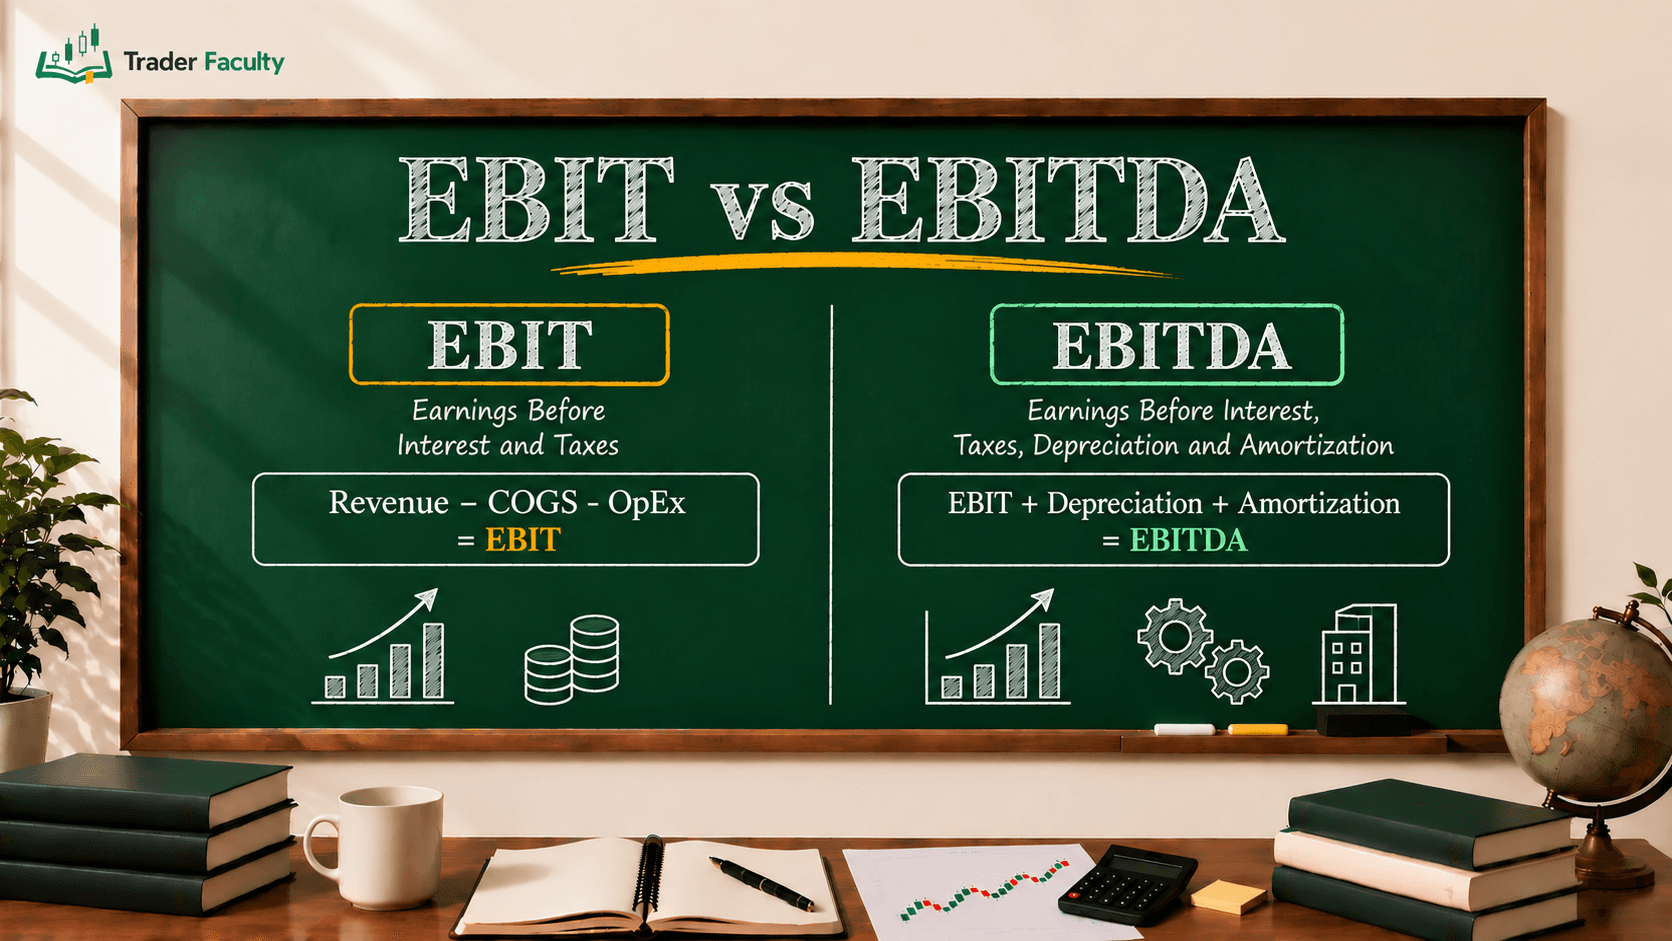
- EBITDA: Serves as an operational proxy for raw earning performance before non-cash depreciation, amortization, taxes, and debt interest expenses are subtracted.
Valuation Multiples and Stock Pricing Metrics
Valuation multiples compare a company's market stock price against its underlying accounting metrics to evaluate whether shares are priced cheap or expensive relative to earnings and balance sheet equity.
Valuation ratios do not tell you if a stock will rise tomorrow, but they provide critical context on market expectations. High multiples signal that investors expect aggressive future growth, while low multiples may reflect deep value or fundamental problems within the business.
Earnings Multiples and Growth Adjustments
Earnings multiples link the current market price of a stock directly to the income generated by the business.
Traders rely on the P/E ratio to measure how much investors pay for each dollar of net corporate income. To calculate earnings multiples accurately, traders first evaluate earnings per share, which splits net income across all outstanding common shares.
Because a simple price-to-earnings metric does not account for future company growth, traders balance it using the PEG ratio. This metric adjusts the valuation multiple against expected earnings growth, helping traders separate high-growth opportunities from overpriced stocks.
Book Value and Intrinsic Pricing
Book-based metrics compare public market capitalization against the underlying accounting value recorded on corporate balance sheets.
- Price-to-book ratio: Compares market capitalization to net asset value, helping traders evaluate asset-heavy businesses like banks and manufacturers.
- Book value: Represents the net asset value belonging to common shareholders if all liabilities were paid off.
- Intrinsic value: Combines financial statement ratios, future cash flow projections, and discount rates to estimate the true fundamental worth of a stock independent of its current market price.
Solvency, Capital Structure, and Cash Generation
Solvency and cash generation metrics evaluate long-term financial stability, capital structure risks, and direct shareholder returns over full economic cycles.
A company can stay solvent short term through credit lines, but excessive long-term debt creates severe financial fragility. Solvency metrics show whether corporate leverage is manageable, while cash flow metrics track the physical money flowing into corporate bank accounts.
Debt Leverage and Capital Balance
Debt leverage metrics track how much borrowed money a business uses to fund its asset growth relative to equity capital provided by shareholders.
Evaluating the debt-to-equity ratio reveals corporate capital structure choices. High debt load increases earnings volatility and interest burdens, especially when interest rates rise. What looks like acceptable leverage in a strong economy can turn dangerous during a sales downturn.
Operational Cash Flow and Shareholder Yields
Cash flow metrics ignore accounting adjustments to measure real cash moving into and out of corporate accounts.
Traders monitor free cash flow to see how much cash remains after funding necessary capital expenditures and property maintenance. Companies with strong cash generation can expand operations, pay down debt, or distribute profits to shareholders through dividends. Stable cash distributions provide consistent returns and signal management confidence in future cash generation.
Macroeconomic Factors and Strategic Synthesis
Financial ratios do not exist in a vacuum. A company's ratios are deeply shaped by broader macroeconomic conditions, industry sector norms, and economic cycles.
For example, capital-intensive utility companies naturally carry higher debt metrics than capital-light software companies. Similarly, during inflationary cycles, rising interest rates increase corporate borrowing costs, directly impacting debt service ratios across whole sectors. Traders must monitor key economic indicators—such as central bank policy rates, inflation metrics, and GDP growth—to understand the macro environment driving corporate numbers.
Official reporting guidance from regulators like the SEC emphasizes reading complete financial statement sets to understand corporate financial health. Never rely on a single ratio to make trading decisions. A stock with an unusually low valuation multiple might look cheap, but if its liquidity ratios are deteriorating and debt leverage is rising, it may be a value trap facing severe operational risk.
Conclusion
Understanding what are financial ratios gives traders the tools needed to assess financial statements, evaluate operational health, and identify market opportunities. By grouping ratios into liquidity, profitability, valuation, and solvency categories, you transform complex accounting reports into actionable trading intelligence. Combining these metrics across economic cycles provides a clear view of corporate stability and long-term business trajectory.
To build a structured equity evaluation strategy, combine ratio analysis with macroeconomic trends and broad valuation models. Continue developing your analytical skills through our guide on fundamental analysis to learn how to integrate balance sheet data into your daily trading framework. Trading carries risk of capital loss, so always combine ratio analysis with risk management strategies before committing capital.
Frequently Asked Questions
What are the 5 main types of financial ratios?
The five main categories of financial ratios are liquidity ratios, profitability ratios, leverage (or solvency) ratios, efficiency ratios, and valuation ratios. Each category measures a distinct aspect of corporate financial health, ranging from short-term debt coverage to long-term stock pricing.
Why are financial ratios important for stock traders?
Financial ratios normalize financial statement data, allowing traders to directly compare companies of different sizes across the same industry. They help traders evaluate whether a company is operating efficiently, managing debt responsibly, or trading at a fair market valuation before taking a position.
What is the difference between liquidity and leverage ratios?
Liquidity ratios measure a company's ability to cover immediate, short-term debt obligations due within one year using liquid assets. Leverage ratios evaluate long-term solvency by measuring how much total debt a company carries relative to its total shareholder equity or asset base.
What are the main limitations of financial ratio analysis?
Financial ratios rely on historical accounting data, which may not reflect future market conditions or unexpected economic shifts. Additionally, different accounting standards (such as GAAP vs. IFRS) and varying industry capital structures can distort direct comparisons between companies.
How do traders combine multiple financial ratios?
Traders avoid relying on any single financial ratio in isolation. Instead, they analyze liquidity, debt levels, profit margins, and valuation metrics together alongside broader macroeconomic indicators to build a complete view of a company's fundamental strength and valuation risks.
The Trader Faculty Team writes and reviews every guide together — pairing hands-on market experience with a curriculum-first approach to trading education. One good syllabus, taught in the order that makes you better.