How to Read a Stock Market Chart and Spot Trends
Learn how to read a stock market chart step by step. Master candlesticks, trends, and volume. Read the full guide.
By Trader Faculty Team
Direct Answer
A stock market chart is a visual map of price action over time, with price on the vertical axis and time on the horizontal axis. Reading it means looking at candlesticks (open, high, low, and close prices for each period) and volume bars (shares traded) to judge whether a move has momentum.
A stock market chart is a visual map showing how the price of a share changes over time based on buying and selling activity. It reflects executed trades, so you can see demand, price trends, and trading volume.
When you open a trading platform for the first time, a price chart can feel overwhelming. Red and green bars, moving average lines (lines that smooth out recent prices), and constant price swings can look like noise.
This guide shows how to read a stock market chart step by step, and if you've searched for how to read stock market charts, you'll find it here. It covers chart types, price trends, volume, and a simple 4-step framework for making sense of price action. It's educational, not investment advice.
Quick Takeaways
- Stock charts show human decision-making by tracking price on the vertical axis and time on the horizontal axis.
- Candlestick charts are popular because they show the open, high, low, and close prices for any timeframe in one picture.
- Volume bars can help show whether a price trend has real buying or selling pressure behind it.
- It usually helps to start on a higher timeframe to find the main trend before you look at smaller price moves.
What Is a Stock Market Chart?
A stock market chart is a graphical record of a stock's price history over a specific period. It shows the ongoing tug-of-war between buyers pushing prices up and sellers pushing prices down. Instead of scrolling through thousands of numerical transactions, you can read the chart to get a quick sense of market sentiment (the overall mood of buyers and sellers).
Every stock chart uses two core axes:
- Vertical Axis (Y-Axis): Displays the stock price level. As price rises, the point moves up; as price falls, it moves down.
- Horizontal Axis (X-Axis): Displays time. Timeframes can range from 1-minute intervals for day trading to monthly intervals for long-term investing.
Understanding what the stock market is helps clarify why prices move. Price changes reflect new information, corporate earnings, or broader economic shifts flowing through order books (lists of buy and sell orders waiting to be filled).
The 3 Main Types of Stock Charts
Traders analyze price movement using three main chart formats. Each offers a different level of detail depending on your style.
1. Line Charts
A line chart is the simplest view of price action. It connects single price points, usually the closing price (the last price of each period), with one line.
- Pros: Strips away intraday price noise, which can make longer-term trends easier to spot.
- Cons: Hides the intraday highs and lows, so it gives you incomplete volatility (price swing) data.
2. Bar Charts (OHLC)
Bar charts show four price points for each period: the Open, High, Low, and Close (OHLC). A vertical line shows the range between the period's highest and lowest price. A small tick on the left marks the opening price, and a tick on the right marks the closing price.
3. Candlestick Charts
Candlestick charts are widely used by technical traders (people who study price charts to make decisions). Like bar charts, candlesticks show OHLC data, but they use a filled rectangular "body" to show the distance between the open and close prices.

- Real Body: The wide section representing the price difference between the period's opening price and closing price.
- Wicks (Shadows): The thin vertical lines extending above and below the body, showing the maximum high and low prices reached during that timeframe.
- Green (or White) Candle: Usually means a bullish period, where the closing price was higher than the opening price. Colors vary by platform, and some markets reverse them.
- Red (or Black) Candle: Usually means a bearish period, where the closing price was below the opening price.
Learning how to read forex charts uses this same candlestick structure, because the mechanics are the same across stocks, foreign exchange, and commodities.
How to Read Price Action and Trends
Reading a stock chart starts with identifying the market structure (the pattern of swing highs and lows). Price doesn't move in a straight line; it moves in waves, creating peaks (highs) and troughs (lows).
Identifying Market Direction
Market trends usually fall into three categories:
- Uptrend: A market structure with higher highs and higher lows. Buyers tend to stay in control, stepping in at higher price levels during pullbacks (short dips within a trend).
- Downtrend: A market structure with lower highs and lower lows. Sellers tend to dominate, pushing prices lower each time price tries to rally.
- Sideways (Consolidation): Price moves within a horizontal range between support and resistance boundaries without a clear direction.
Support and Resistance Levels
Support and resistance are price levels where an imbalance between supply and demand has previously caused price to change direction.
- Support (Floor): A price level where buying interest has been strong enough to slow or stop a decline.
- Resistance (Ceiling): A price level where selling pressure has been strong enough to slow or stop a rise.
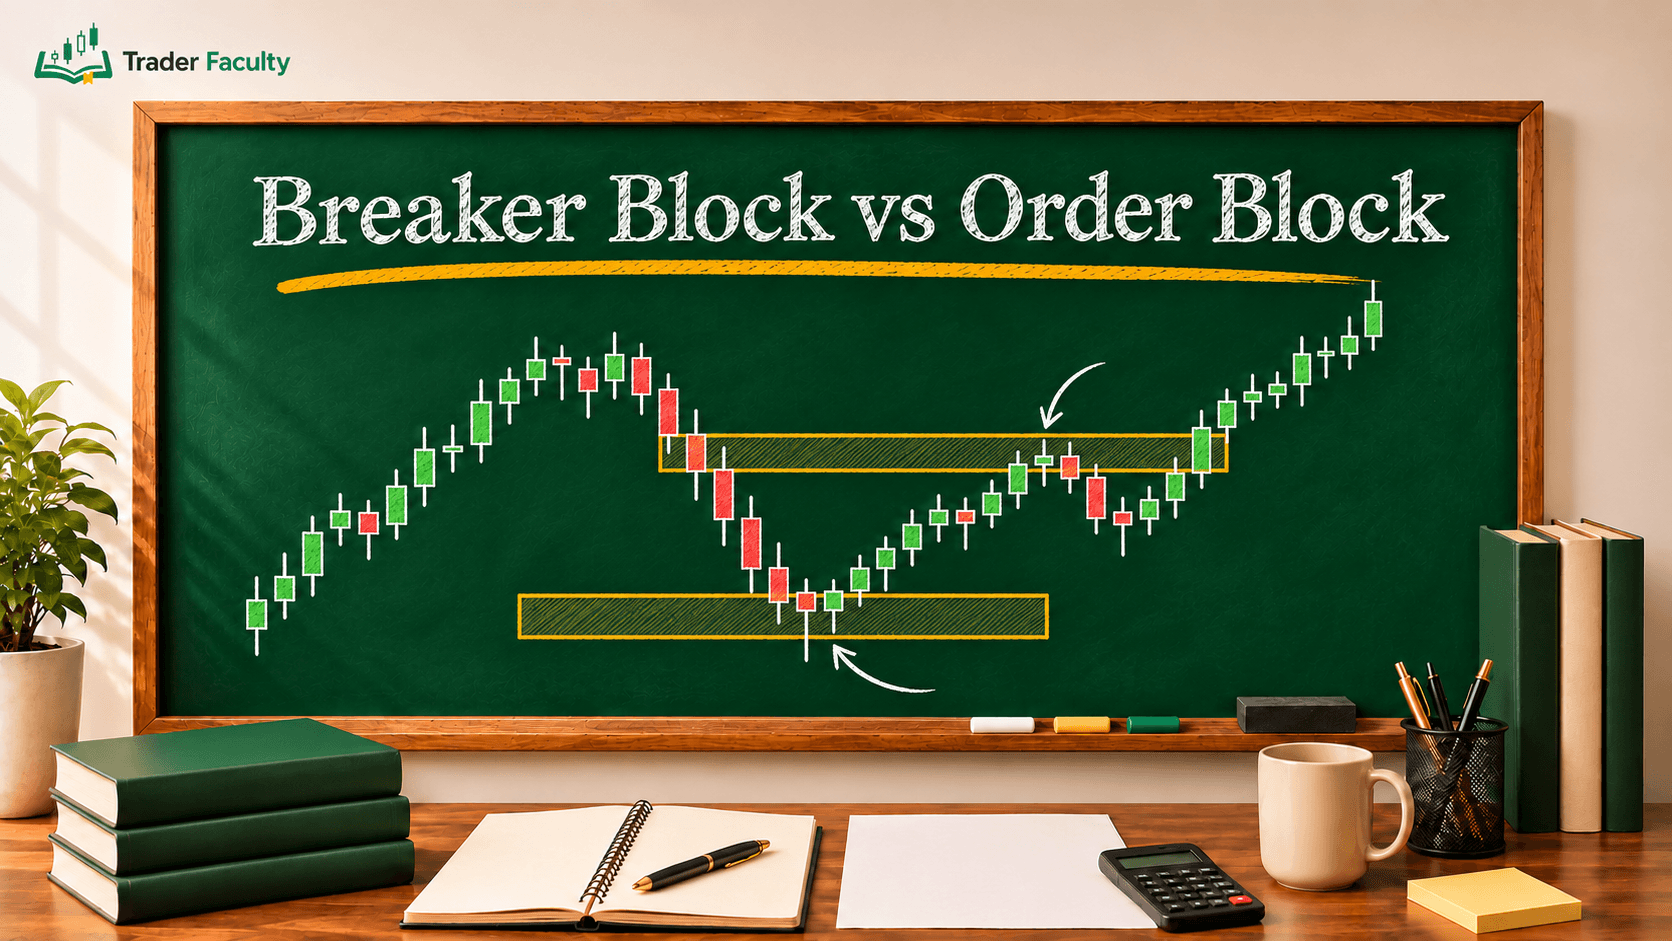
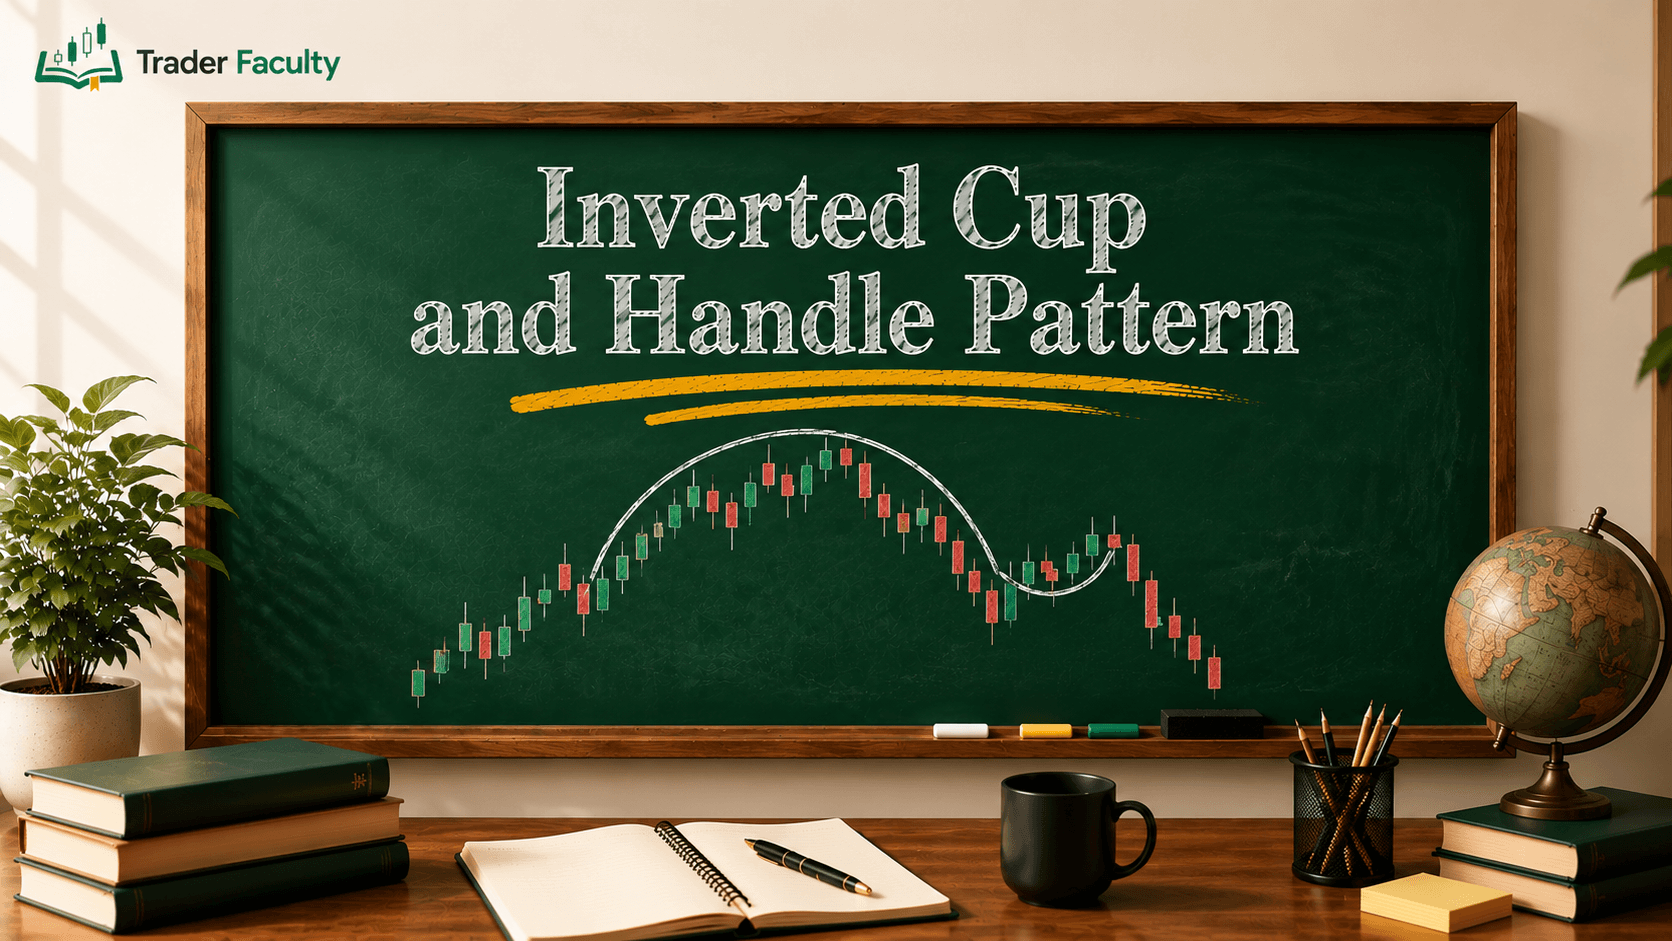
When price repeatedly tests these horizontal levels, traders watch for breakouts (a move beyond the level) or reversals (a change of direction). Studying recurring setups like head and shoulders or double bottoms is part of learning chart patterns, which can help you think through probabilities, not certainties.
Understanding Volume: The Chart’s Fuel
Price action tells you where price is moving, but volume tells you how strong the move is. Volume measures the total number of shares traded during a given timeframe.
Volume appears as vertical bars along the bottom of the chart:
- High Volume on Green Candles: Can suggest strong buying interest, which may support upward momentum.
- High Volume on Red Candles: Can suggest heavy selling pressure, which may point to larger holders reducing positions (often called distribution).
- Price Breakouts on Low Volume: A common warning sign. If a stock breaks above resistance on low volume, the move may lack broad participation and carries a higher risk of a false breakout (a bull trap, where buyers get caught as price reverses).
A 4-Step Framework for Reading Any Chart
To keep your analysis systematic and reduce emotional decisions, apply this four-step process each time you open a chart.
Step 1: Set the Timeframe
Match your chart timeframe to your holding period:
- Investors & Position Traders: Daily, weekly, and monthly charts.
- Swing Traders: 4-hour and daily charts.
- Day Traders: 1-minute, 5-minute, and 15-minute intraday charts (charts that cover a single day).
Step 2: Identify the Main Trend
Zoom out to see the big picture first. Try not to trade against the dominant higher-timeframe trend without an explicit reason.
Step 3: Locate Key Price Levels
Mark horizontal support and resistance lines where price has reversed before. These are areas where the market has often reacted, though it won't always react again.
Step 4: Look for Confirmation
Wait for price action signals, such as a candlestick rejection (a long wick showing price was pushed back) at support backed by high volume, before you make a trading decision.
Common Mistakes Beginners Make When Reading Charts
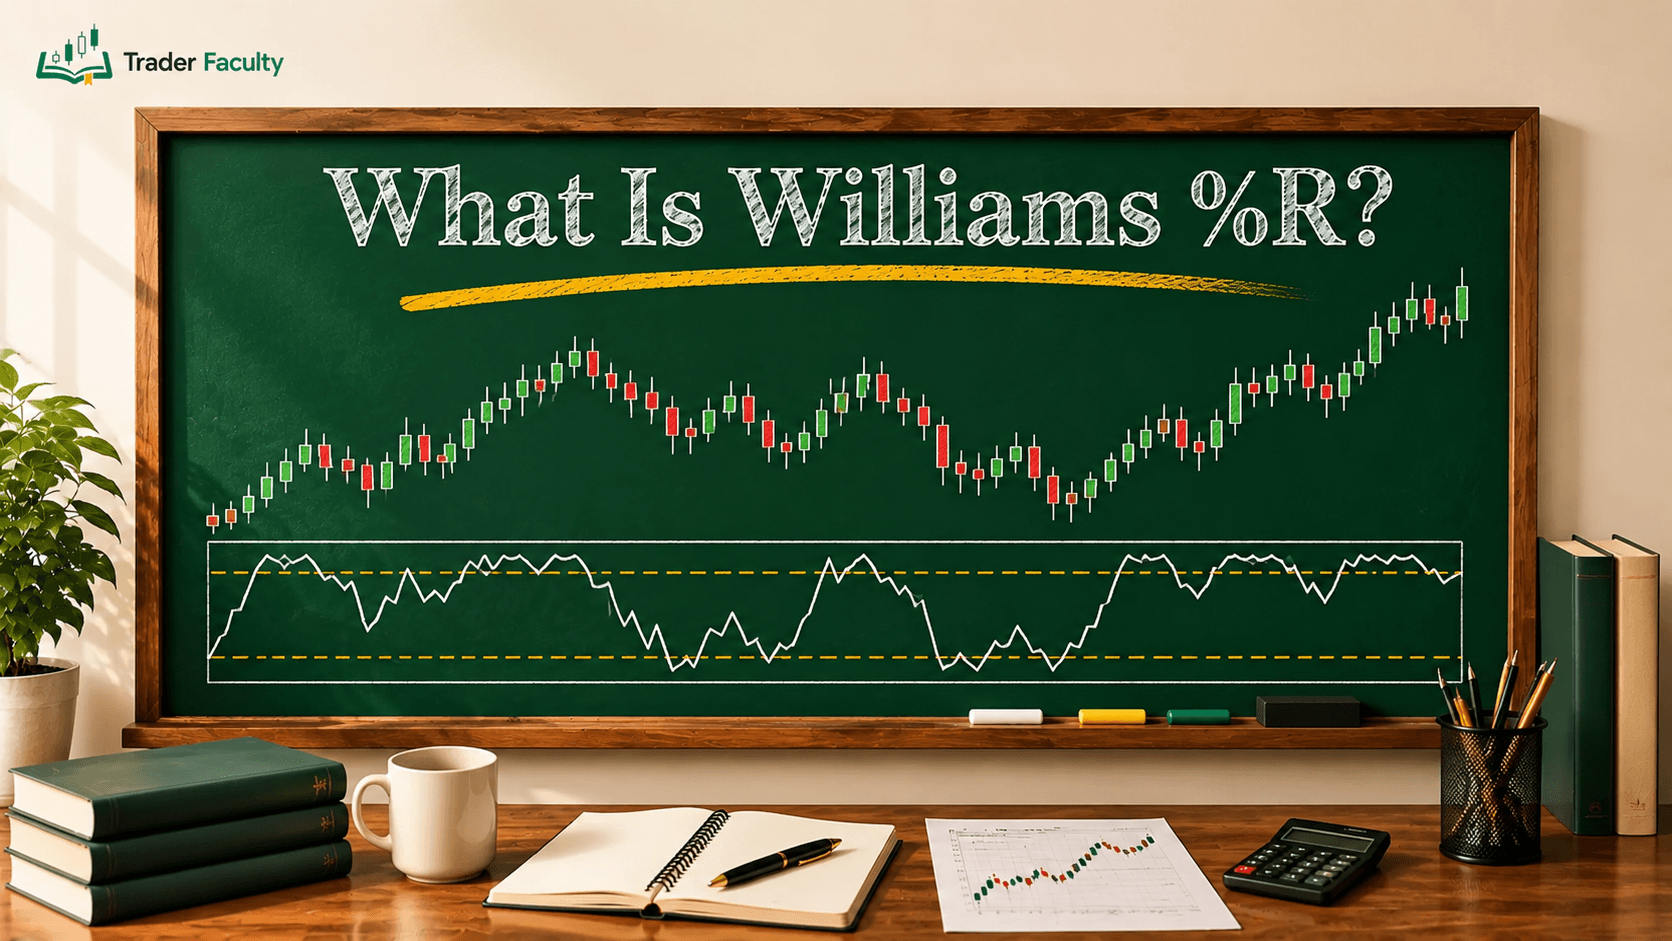
- Indicator Overload: Adding five or six overlapping technical indicators (like RSI, MACD, and Bollinger Bands, which measure momentum and volatility) to one chart creates clutter and can lead to "analysis paralysis."
- Ignoring the Higher Timeframe: Acting on a bullish signal on a 5-minute chart while the daily chart is in a strong downtrend means you're trading against the larger trend.
- Forcing Patterns: Beginners often convince themselves a chart pattern exists when the price action is simply random noise. If you have to strain to see a pattern, treat it with caution.
Conclusion
Learning how to read a stock market chart means viewing price and volume as a visual record of supply and demand. By identifying the primary trend, drawing key support and resistance levels, and confirming price action with volume bars, you can build a systematic approach to reading stock market charts without relying on guesswork.
As you build your chart reading skills, focus on basic price structures before adding technical overlays. Trading involves risk of loss, and chart analysis looks at historical probability, so past performance doesn't guarantee future results.
Frequently Asked Questions
What are the three main types of stock market charts?
The three main types of stock charts are line charts, bar charts (OHLC), and candlestick charts. Line charts show closing prices, bar charts display price ranges, and candlestick charts show the open, high, low, and close in one visual.
How do you read a candlestick on a stock market chart?
A candlestick shows four price points for a period. The rectangular body shows the space between the open and close, while thin wicks extend to the highest and lowest prices. Green candles usually mean price closed higher and red candles usually mean it closed lower, though colors vary by platform.
What do red and green volume bars mean on a stock chart?
Volume bars show the total number of shares traded during a timeframe. Green volume bars usually indicate heavy trading during a price rise, while red volume bars usually signal high activity during a price drop. Color conventions can differ by platform.
Which timeframe is best for beginners learning chart analysis?
Many beginners start with daily and weekly charts. Higher timeframes filter out short-term noise, which can make it easier to spot primary trends and key support or resistance levels before moving to intraday charts.
Can reading stock charts guarantee future price direction?
No. Stock chart analysis can't guarantee future price movements. It looks at historical price behavior and supply-demand levels to help you make structured decisions, but unexpected events can invalidate any technical pattern.
Keep learning
TA Masterclass
Reading charts one article at a time? Get the full method, in order.
10 lessons quiz
Start TA MasterclassThe Trader Faculty Team writes and reviews every guide together — pairing hands-on market experience with a curriculum-first approach to trading education. One good syllabus, taught in the order that makes you better.