Indicators for Day Trading: A Beginner's Guide
Learn how indicators for day trading work and how to build a clean 3-step intraday stack. Read the full guide.
By Trader Faculty Team
Direct Answer
Indicators for day trading are mathematical calculations based on historical price, volume, or open interest that help traders gauge market direction, speed, and volatility within a single session. Common intraday tools include VWAP for volume context, EMAs for trend tracking, RSI for momentum, and ATR for volatility-based risk. Many day traders combine two or three complementary indicators with price action to reduce conflicting signals and chart clutter.
Day trading moves fast. Prices can shift in seconds, driven by order flow, news, and institutional volume. In this environment, staring at a raw price chart can feel like reading a screen without a translation key.
To make sense of the noise, intraday traders often rely on technical indicators. But cluttering your chart with dozens of overlapping tools can lead to analysis paralysis rather than clarity. Understanding how core indicators work, what they measure, and how to combine them into a clean setup can help you build an objective intraday trading plan.
Quick Takeaways
- Technical indicators don't predict the future; they mathematically summarize past price, volume, or volatility data.
- Day traders must balance lagging trend indicators with leading momentum oscillators to avoid redundant signals.
- VWAP (Volume-Weighted Average Price) is a widely watched intraday benchmark used by retail and institutional traders alike.
- Dynamic stop-loss placement using Average True Range (ATR) can help account for intraday noise.
- An efficient day trading setup often relies on no more than two or three complementary indicators.
What Are Technical Indicators in Day Trading?

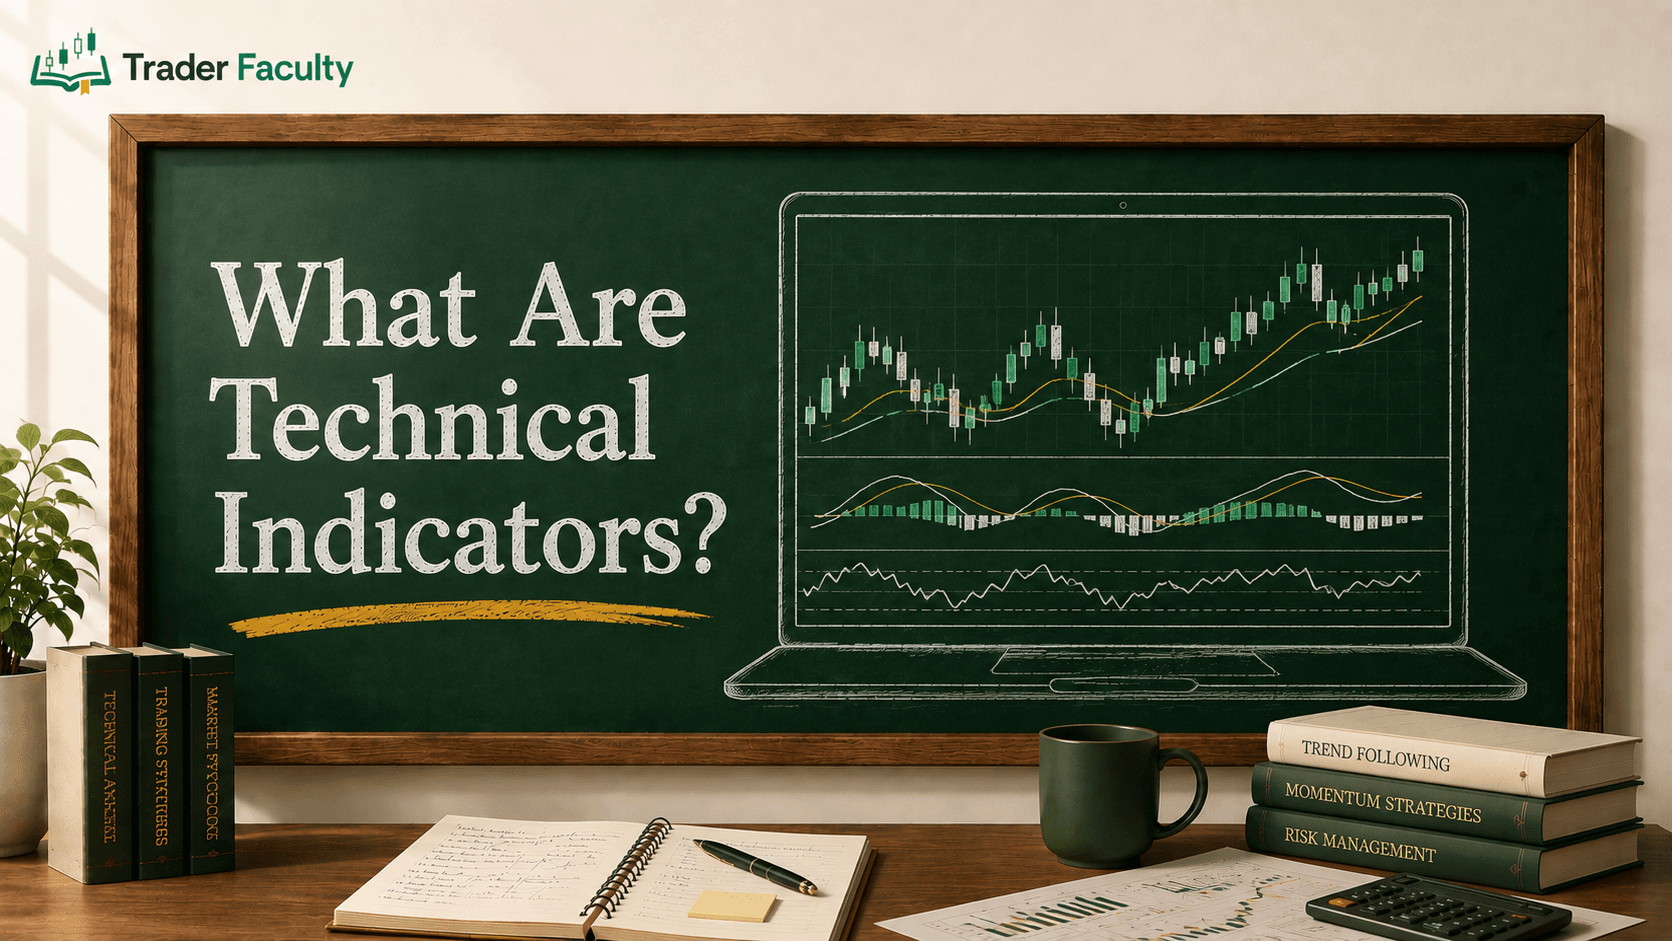
In day trading, a technical indicator is a mathematical calculation based on historical price, volume, or open interest (the number of outstanding derivative contracts). It helps traders evaluate market conditions and spot potential setups within a trading day.
Unlike long-term investors who rely on fundamentals like corporate earnings or economic reports, day traders often need rapid data. Technical indicators turn price action into visual lines, histograms, and bands directly on your trading chart.
When you ask what technical indicators are in day trading, it helps to treat them as measurement tools rather than crystal balls. Indicators highlight market momentum, overextended price levels, and emerging trends. They work as confirmation tools alongside key price levels, market structure, and overall liquidity.
If you've searched "what is indicators for day trading," "indicators for day trading meaning," or "indicators for day trading explained," the short version is that these are measurement tools, not prediction tools.
How Intraday Indicators Work: Lagging vs. Leading Mechanics
To use indicators effectively, you need to understand their mechanics. They generally fall into two functional categories: lagging tools and leading tools.
| Feature | Lagging Indicators | Leading Indicators / Oscillators |
|---|---|---|
| Core Purpose | Confirm trend direction | Measure momentum & speed |
| Calculation Basis | Smoothed historical prices | Rate of price change over time |
| Primary Advantage | Filters out intraday noise | Flags potential early reversals |
| Key Risk | Delayed entries during fast moves | False signals in trending markets |
| Common Examples | EMA, SMA, MACD | RSI, Stochastic Oscillator |
Lagging Indicators (Trend-Following)
Lagging indicators react to price movement that has already occurred. Their primary function is to filter out random intraday fluctuations and highlight the underlying market direction.
For instance, a moving average smooths out minute-by-minute volatility to show whether buyers or sellers hold control over a broader timeframe. Lagging tools can give steadier signals during sustained trends, but they inherently enter trades after a move has already started.
Leading Indicators (Momentum & Oscillators)
Leading indicators measure the velocity and momentum of price action over a specified period. Most leading tools are oscillators — indicators that bound calculated values within a specific numerical range (typically 0 to 100).
When an oscillator reaches an extreme high or low, it suggests price may have moved too far, too fast, which can signal potential exhaustion or a short-term pullback. During strong trend days, though, leading indicators can stay in overextended territory for a long time, generating early or incorrect counter-trend signals.
Execution Reality: Every technical indicator is built on past data. No mathematical formula can forecast unexpected news headlines or sudden institutional order flow. Indicators describe what price has done; execution requires managing the risk of what price does next.
Core Categories of Indicators for Day Trading
Many day traders avoid relying on a single indicator. Instead, they pick one core tool from distinct measurement categories to build a fuller view of intraday conditions.
1. Trend-Following Tools: Exponential Moving Averages (EMA)
While Simple Moving Averages (SMA) weigh all data points equally, the Exponential Moving Average (EMA) applies greater weight to recent price data. This responsiveness makes it a popular tool for intraday market participants.
Day traders commonly watch short-term EMAs (such as the 9-period and 20-period EMAs on 1-minute or 5-minute charts) to gauge intraday direction:
- Bullish Bias: Price trades consistently above key EMAs, with the shorter EMA sloping upward above the longer EMA.
- Bearish Bias: Price trades below key EMAs, with the shorter EMA sloping downward below the longer EMA.
2. Momentum Tools: Relative Strength Index (RSI) & MACD
Momentum indicators gauge how aggressively market participants are buying or selling an asset.
- Relative Strength Index (RSI): The RSI measures the speed and change of price movements on a scale of 0 to 100. Traditionally, readings above 70 indicate overbought conditions (bought quickly enough that a temporary slowdown is possible), while readings below 30 signal oversold conditions. Day traders often use RSI divergence — where price makes a new high but RSI makes a lower high — to spot weakening momentum.
- Moving Average Convergence Divergence (MACD): The MACD tracks the relationship between two exponential moving averages (typically the 12-period and 26-period). The crossover of the MACD line and its signal line provides visual confirmation of shifts in intraday momentum.
3. Volume Benchmark: Volume-Weighted Average Price (VWAP)
The VWAP is widely watched as an intraday anchor by professional day traders and institutional execution desks. Unlike standard moving averages, VWAP calculates the average price an asset has traded at throughout the day, weighted by trading volume.
VWAP Formula:
VWAP = Sum of (Price × Volume) / Total Cumulative Volume
Because institutional traders often use VWAP to measure execution quality, intraday price frequently interacts with the VWAP line:
- Above VWAP: Intraday buyers may be in control, and some traders see long positions as aligned with institutional execution value.
- Below VWAP: Intraday sellers may dominate, and some traders see short positions as aligned with institutional execution.
4. Volatility & Risk Management: Average True Range (ATR)
Understanding market volatility — how wide price swings are over a given timeframe — matters for setting dynamic trade parameters. The ATR measures average price movement between highs and lows across a set number of candles.
Day traders use ATR to set realistic profit targets and dynamic stop-loss distances:
- If 5-minute ATR is $0.50, placing a $0.10 stop-loss invites unnecessary stop-outs from normal market noise.
- Setting stop-loss distances at a multiple of ATR (such as 1.5x ATR) lets risk parameters adjust as intraday volatility expands or contracts.
Building a Clean 3-Step Day Trading Stack
A common mistake among new traders is adding too many tools to a chart. Placing RSI, Stochastic, and Williams %R on the same screen creates redundant signals because all three measure the same underlying rate-of-change data.
To prevent chart clutter, here's a simple 3-step decision framework. It's an example for study, not a recommendation:
- Establish Direction (Context): Check VWAP or the 20 EMA on your primary execution timeframe. If price sits above VWAP, some traders focus on buy setups.
- Confirm Momentum (Trigger): Some traders wait for price to pull back to key levels (like VWAP or dynamic support) while checking RSI for bullish momentum confirmation.
- Define Risk Parameters (Execution): Use the current ATR calculation to establish stop-loss distances and position sizing before opening the trade.
Common Indicator Mistakes Day Traders Make
Even effective technical indicators can cause trading losses when misused. Watch for these three beginner traps:
- Indicator Overload (Analysis Paralysis): Stacking four or five indicators on one chart often leads to conflicting signals: one says buy, another says sell, and a third stays neutral. Limit your setup to two or three complementary tools.
- Ignoring Price Action & Key Levels: Taking an indicator signal blindly without checking price structure is risky. An overbought RSI reading during a powerful breakout against major resistance can end in a loss. Consider prioritizing market structure, candlestick patterns, and support/resistance over indicator signals.
- Constant Parameter Adjustments: Switching moving average periods or RSI settings after a series of losing trades can lead to curve-fitting (over-optimizing to past data). Default settings, such as a 14-period RSI or 20-period EMA, are widely used, so many traders watch the same levels. Platform defaults vary, so check yours.
Conclusion
Technical indicators provide structure and objective measurements in fast-moving intraday markets. Whether you use VWAP to measure institutional value, EMAs to spot trend direction, or ATR to size risk, indicators work best as supporting tools rather than standalone signal generators. Trading carries risk of loss, and past performance doesn't guarantee future results.
Developing a consistent system requires combining clear price action analysis with a clean, low-clutter indicator stack. To expand your analytical skillset and learn how professional traders combine tools with risk management strategies, explore our comprehensive technical analysis curriculum.
Frequently Asked Questions
What are the best indicators for day trading?
The most widely used indicators for day trading include VWAP for volume analysis, EMAs for short-term trend identification, RSI for momentum, and ATR for setting volatility-based stop-loss levels.
How many indicators should I use when day trading?
Many day traders use no more than two or three complementary indicators. Using too many tools that measure the same underlying data (such as three momentum oscillators) can lead to chart clutter and analysis paralysis.
What is the difference between leading and lagging day trading indicators?
Lagging indicators, like moving averages, react to past price data to confirm established trends. Leading indicators or oscillators, like RSI or Stochastic, measure the velocity and momentum of price changes to signal potential exhaustion or short-term reversals.
Why is VWAP so important for day traders?
VWAP factors both price and total volume into a single intraday benchmark. Institutional traders often use it to evaluate execution quality, which makes it a commonly watched support and resistance level that typically resets at the start of each trading session.
Can technical indicators predict future stock prices?
No technical indicator predicts future price movements with certainty. All indicators mathematically summarize historical price and volume data to calculate probabilities and quantify risk alongside price action and market structure.
Keep learning
TA Masterclass
Reading charts one article at a time? Get the full method, in order.
10 lessons quiz
Start TA MasterclassThe Trader Faculty Team writes and reviews every guide together — pairing hands-on market experience with a curriculum-first approach to trading education. One good syllabus, taught in the order that makes you better.