Reversal Candlestick Patterns: How to Spot Trend Turns
Learn how reversal candlestick patterns spot trend turns at key price levels. Read the full guide.
By Trader Faculty Team
Direct Answer
Reversal candlestick patterns are visual price formations on a trading chart that signal a potential change in the prevailing market trend direction. They highlight moments where buying or selling pressure may be shifting between market participants at key support or resistance levels. Identifying these patterns can help traders spot weakening momentum and plan disciplined trade entries.
Candlestick reversals are key visual price formations that indicate when an ongoing market trend is losing momentum and is about to change direction. Every price candle records the open, high, low, and close prices over a specific timeframe, reflecting the real-time balance of supply and demand between buyers and sellers. Identifying these patterns helps you recognize shifting market control early and plan structured entries with defined risk boundaries.
A common trap in technical analysis is entering trades as soon as a single candle shape appears on a lower timeframe without checking broader chart structure. Isolated patterns can produce false signals, especially in flat or choppy markets. This guide details key single-candle and multi-candle reversal structures, how to confirm price turns with key support and resistance levels, and how to set protective stop-loss orders to manage trading risk effectively.
Quick Takeaways
- These patterns show visual shifts in market control between buyers and sellers at key price levels.
- A clear prior trend is required for any reversal pattern to provide technical meaning.
- Single-candle patterns give early signals, while multi-candle formations tend to offer stronger confirmation.
- Combining candlestick signals with support, resistance, and volume can reduce false breakout risk.
- Protective stop-loss placement beyond pattern high or low wicks helps manage risk when setups fail.
What Are Reversal Candlestick Patterns?
These formations are price chart signals that indicate a shift in market sentiment from buyers to sellers or from sellers to buyers. Every price candle records the open, high, low, and close prices over a specific timeframe, reflecting the ongoing battle between supply and demand. A downtrend is a series of lower highs and lower lows, while an uptrend is a series of higher highs and higher lows.
To evaluate any reversal setup properly, a prior trend must exist. A reversal pattern appearing in a sideways or flat market carries little predictive value because there isn’t an established trend to turn.
Unlike continuation patterns—which suggest price will resume its current trend after a brief pause—reversal patterns signal that the dominant force is losing control. Recognizing these shifts can help you plan trade entries, tighten stop-loss orders, or exit existing positions before price moves against you.
Key Bullish Reversal Candlestick Patterns
Bullish reversal candlestick patterns form at the bottom of a downtrend and signal that buyers are taking control from sellers. These structures indicate that selling pressure is weakening and price may begin moving upward.
Traders often look for specific multi-candle structures and single bullish candlestick patterns near established support levels — key price floors where buying interest repeatedly enters the market.
- Hammer: A single-candle pattern with a small real body near the top of the price range and a long lower wick (the thin line showing price extremes). The wick is at least twice the length of the body. It shows that sellers pushed price significantly lower during the session, but buyers aggressively pushed price back up before the close.
- Bullish Engulfing: A two-candle pattern where a small bearish red candle is completely covered by a large bullish green candle. The second candle’s body fully covers the first candle’s body, showing buyers absorbing (buying up) the available selling supply. Candle colors vary by platform.
- Morning Star: A three-candle pattern starting with a long bearish candle, followed by a small-bodied candle showing market indecision, and concluding with a strong bullish candle closing well into the body of the first candle.
- Bullish Harami: A two-candle pattern where a large bearish candle is followed by a small bullish candle fully contained within the prior candle’s body. It signals that selling momentum is stalling and buyers may be stepping in.
- Dragonfly Doji: A single-candle pattern with little to no real body and a long lower wick, showing that sellers pushed price down but buyers fully recovered it by the close. It suggests strong rejection of lower prices.
- Piercing Line: A two-candle pattern where a bearish candle is followed by a bullish candle. The bullish candle opens below the prior low and closes above the midpoint of the first candle’s body, suggesting strong buying demand.’s body, confirming strong buying demand.
Key Bearish Reversal Candlestick Patterns

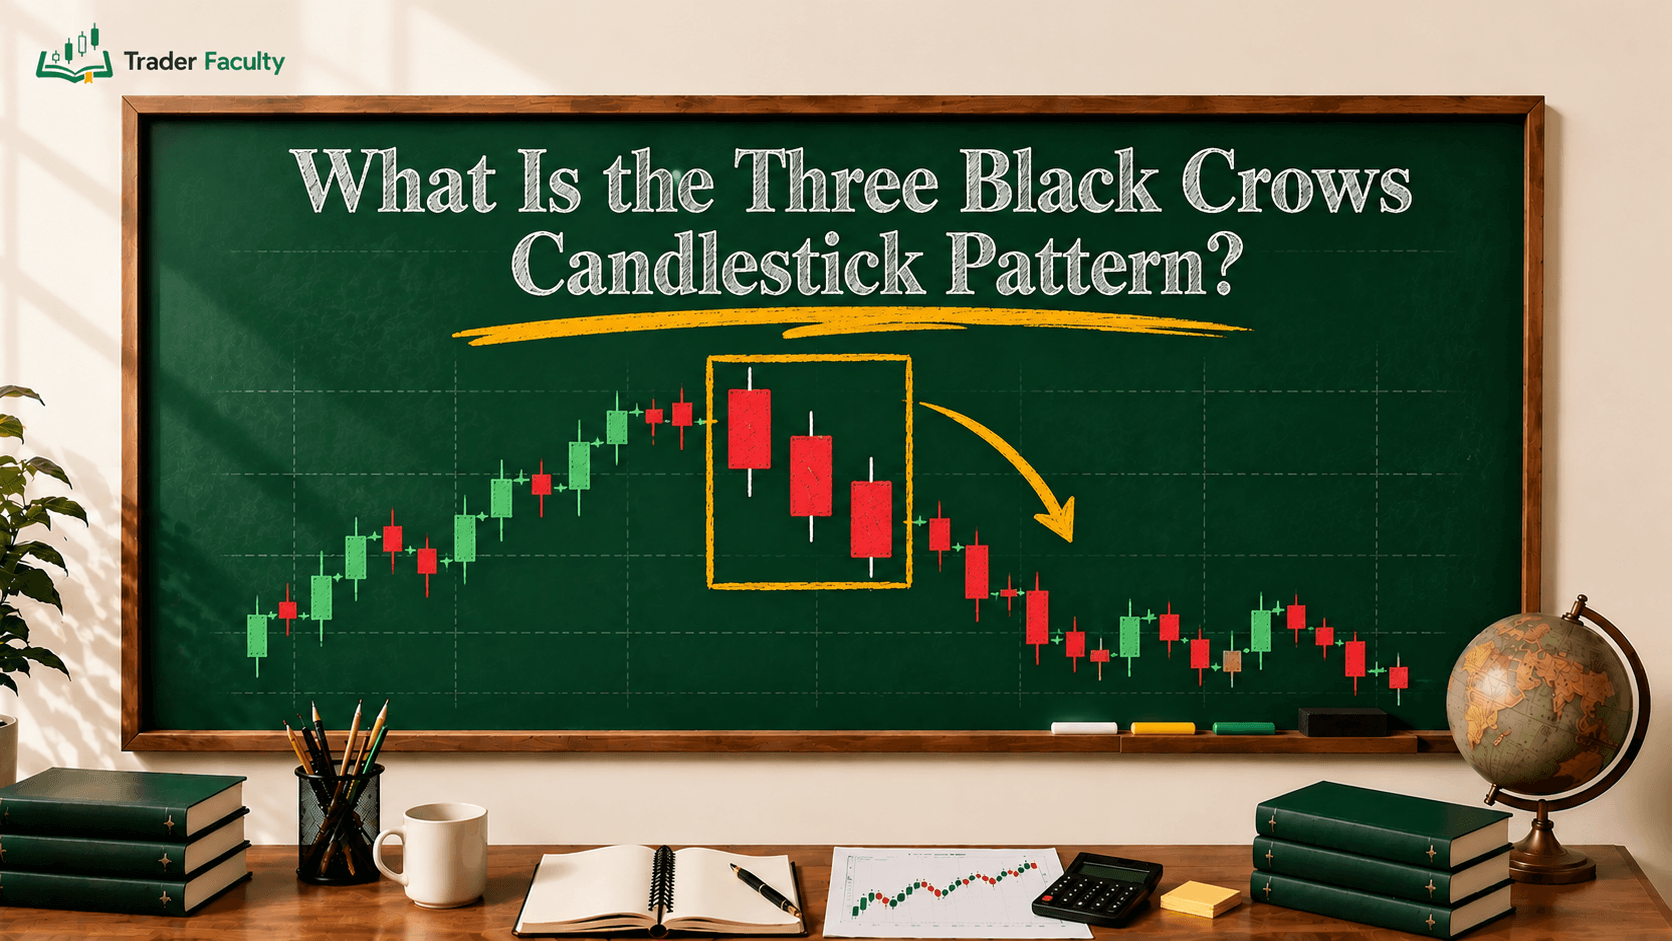
Bearish reversal candlestick patterns form at the top of an uptrend and signal that sellers are regaining control from buyers. They show that upward momentum is exhausting and price may begin dropping.
These setups tend to carry more weight near resistance levels — price ceilings where selling supply has often exceeded buying demand.
- Shooting Star: A single-candle pattern featuring a small real body near the bottom of the range and a long upper wick at least twice the body length. It indicates buyers tried to drive price higher, but sellers rejected the move and pushed price back down before the close.
- Bearish Engulfing: A two-candle formation where a small green candle is completely covered by a large red candle. This suggests aggressive selling has overwhelmed the earlier buying demand.
- Evening Star: A three-candle top formation that starts with a long bullish candle, transitions through a small-bodied indecision candle, and ends with a strong bearish candle closing deep inside the first candle's body.
- Bearish Harami: A two-candle pattern where a large bullish candle is followed by a small bearish candle fully contained within the prior candle’s body, indicating that upward momentum is fading.
- Hanging Man: A single-candle pattern with a small real body near the top of the range and a long lower wick, appearing after an uptrend. It can warn that selling pressure is building beneath the surface.
| Pattern Name | Type | Candle Count | Primary Market Signal |
|---|---|---|---|
| Hammer | Bullish | Single | Sellers rejected at low prices |
| Bullish Engulfing | Bullish | Two | Buyers absorb prior selling candle |
| Morning Star | Bullish | Three | Three-step bottoming and trend shift |
| Shooting Star | Bearish | Single | Buyers rejected at high prices |
| Bearish Engulfing | Bearish | Two | Sellers absorb prior buying candle |
| Evening Star | Bearish | Three | Three-step topping and trend shift |
| Marubozu | Bullish/Bearish | Single | Strong one-sided momentum with no wick rejection |
| Pin Bar | Bullish/Bearish | Single | Sharp rejection wick signaling a potential reversal |
Two patterns in the table deserve a quick definition. A Marubozu is a candle with a full body and little or no wicks, showing that one side stayed in control from open to close. A Pin Bar is a candle with a small body and one long wick, showing that price was pushed away from a level. Either one can be bullish or bearish depending on where it appears.
Single-Candle vs. Multi-Candle Reversals
Single-candle and multi-candle reversal structures balance signal speed against signal reliability. Understanding the difference helps you choose entries that fit market volatility — the rate at which price changes over time.
Single-candle formations like the Hammer or Shooting Star provide early warnings of potential trend exhaustion. Because they require only one period to complete, they allow earlier entries with tight stop-loss placement. However, single candles tend to produce more false signals when you trade them without secondary confirmation.
Multi-candle formations like the Engulfing or Star patterns require two or three periods to develop fully. They tend to offer stronger structural confirmation because they show a sustained shift in supply and demand across several periods. The trade-off is a later entry price, which can shrink your reward-to-risk ratio (how much you stand to gain compared with how much you risk).
Bullish vs Bearish Reversals: Key Differences
Bullish reversal candlestick patterns and bearish reversal candlestick patterns differ primarily in their chart location, market sentiment, and technical confirmation requirements. Bullish setups require a clear prior downtrend, developing near support floors where buyers absorb excess supply. In contrast, bearish setups require a prior uptrend, forming near resistance ceilings where sellers reject elevated prices. Identifying these distinct structural requirements helps you avoid entering trades against prevailing market momentum.
| Feature | Bullish Reversal Patterns | Bearish Reversal Patterns |
|---|---|---|
| Prior Trend | Established Downtrend | Established Uptrend |
| Chart Location | Key Support Levels | Key Resistance Levels |
| Market Action | Buyers absorb selling supply | Sellers reject higher prices |
| Primary Examples | Hammer, Bullish Engulfing, Morning Star | Shooting Star, Bearish Engulfing, Evening Star |
Confirming Reversal Signals with Market Context
Trading candlestick patterns in isolation is a common reason new traders run into false breakouts (price pushes past a level, then quickly reverses). A candlestick pattern isn’t a standalone trade trigger; it’s a structural confirmation tool that needs market context.
To improve setup accuracy, combine candlestick patterns with these key technical factors:
- Key Support and Resistance Levels: Focus on bullish patterns at well-tested support floors and bearish patterns at well-tested resistance ceilings. Reversal patterns that form in the middle of a price range tend to be less meaningful because they aren’t near a known level.
- Moving Average Confluence: Look for patterns that form where several moving averages overlap, for example near the 50-day or 200-day simple moving average (the average closing price over the last 50 or 200 days). That overlap can add extra confirmation to the signal.
- Volume Expansion: A reversal pattern is more convincing when trading volume rises on the reversal candle, since that can point to stronger participation behind the move.
- Wait for Candle Close: Avoid acting while the pattern candle is still forming. A bullish Engulfing candle can collapse into a bearish break in the final minutes of a session, so you’ll want to wait for the close.
Here’s a hypothetical example. A stock slides from $52 to $48 over several days, then prints a Hammer that opens at $48.00, dips to $46.80 near a support level around $47, and closes at $48.20 on rising volume. The next candle also closes higher.
After that confirmation, you might place a buy order near $48.50 with a stop-loss at $46.50, just beyond the Hammer’s wick. That’s $2.00 of risk per share. A first target at the prior $52 level would offer $3.50 of potential reward, or about 1.75 times your risk. This is a simplified illustration, not a trade recommendation.
Common Mistakes When Trading Reversal Patterns
Even experienced traders make repeatable mistakes when interpreting reversal patterns on live price charts. Recognizing these traps helps protect capital and maintain discipline.
- Trading Without a Prior Trend: Attempting to trade a Hammer in a flat, sideways market is usually ineffective because there isn’t any downward momentum to reverse.
- Ignoring Market Timeframe: Reversal patterns on 1-minute or 5-minute charts often show heavy price noise and false signals. Higher timeframes like 1-hour, 4-hour, or daily charts tend to give cleaner setups.
- Setting Stop-Losses Too Tight: Placing a protective stop-loss right at the tip of a candle wick can lead to premature exits. Normal market spread (the difference between the buy and sell price) and short-term volatility can easily reach that level.
Reversal Candlestick Patterns PDF Cheat Sheet Summary
Traders often save a reversal candlestick patterns pdf guide at their desk for fast visual recognition during live market sessions. A clear reference guide helps identify candle structures quickly without second-guessing shape requirements under time pressure.
When building or downloading a technical cheat sheet, focus on four key components for each pattern:
- Prior Trend Requirement: Downtrend for bullish setups; uptrend for bearish setups.
- Body and Wick Ratio: Location of the real body relative to upper and lower wicks.
- Volume Characteristics: Higher volume on the reversal candle suggests stronger market interest.
- Invalidation Level: The price beyond the pattern wick where the setup is proven wrong, which is also where your stop-loss belongs.
Using a structured summary checklist helps keep your trade execution consistent and reduces emotional guesswork during fast-moving market conditions.
Conclusion
Understanding these candlestick signals gives you a clear visual method for spotting changing market momentum at key price levels. By focusing on setups like Engulfing candles, Stars, and Hammers near key support and resistance zones, you can build a more systematic approach to evaluating possible market turns.
To improve your technical accuracy, always combine individual candlestick signals with broader market structure and volume context. Learning how to read candlestick charts as a complete price story — rather than hunting for single patterns in isolation — builds the foundation for long-term trading consistency.
Trading financial markets involves risk, and price action patterns don’t guarantee future turns. Always use protective stop-loss orders and risk management rules to protect your trading account when patterns fail.
Frequently Asked Questions
Which candlestick reversal setups tend to be more reliable?
Patterns that involve multiple candles, such as the Bullish Engulfing, Bearish Engulfing, Morning Star, and Evening Star, generally offer stronger structural confirmation than single-candle patterns like the Hammer or Shooting Star. However, reliability depends heavily on whether the pattern forms at an established support or resistance level with strong trading volume.
What is the difference between bullish and bearish reversal candlesticks?
Bullish reversals form at the bottom of a downtrend and signal that buyers are taking control from sellers, indicating price may move upward. Bearish reversals form at the peak of an uptrend and signal that sellers are regaining control from buyers, indicating price may drop.
How do you confirm a candlestick pattern reversal?
You confirm a candlestick pattern reversal by waiting for the reversal candle to close completely and checking whether trading volume rises on that candle. You should also see whether the pattern lines up with a nearby support or resistance level (known as confluence). Waiting for the next candle to close in the direction of the expected reversal adds extra confirmation.
Can a reversal candlestick pattern fail?
Yes, these patterns can fail, resulting in false breakouts or continuation of the original trend. Pattern failures often occur during high-impact economic news releases, in low-volatility or sideways markets, or when patterns form in isolation without support or resistance context.
Which timeframe works best for these patterns?
Higher timeframes, such as the 1-hour, 4-hour, and daily charts, tend to offer more dependable setups because they filter out short-term market noise. Patterns on lower timeframes, like 1-minute or 5-minute charts, often produce false signals because of spread and minor price fluctuations.
Keep learning
TA Masterclass
Reading charts one article at a time? Get the full method, in order.
10 lessons quiz
Start TA MasterclassThe Trader Faculty Team writes and reviews every guide together — pairing hands-on market experience with a curriculum-first approach to trading education. One good syllabus, taught in the order that makes you better.