Technical Analysis: The Complete Guide to Reading Market Price Action

Direct Answer
Technical analysis is a trading methodology that evaluates market opportunities by analyzing historical price trends, chart patterns, and trading volume. Rather than measuring an asset's intrinsic value, it uses visual price structure and mathematical indicators to calculate statistical probabilities and manage trading risk.
Technical analysis is the framework traders use to evaluate financial markets by studying historical price movements, chart patterns, and trading volume to identify statistical probabilities.
If you have ever stared at a live price chart feeling overwhelmed by fluctuating candles and overlapping lines, you are not alone. Transitioning from visual noise to clear market structure is the biggest hurdle developing traders face.
Whether you are analyzing equities, crypto, or conducting forex technical analysis, this guide breaks down chart reading into structured building blocks so you can navigate the market with confidence.
Quick Takeaways
- Technical analysis measures statistical probabilities and risk-to-reward ratios rather than predicting exact future price movements.
- Chart reading rests on three core elements: price action, key horizontal levels, and trend structure.
- Indicators like moving averages and momentum oscillators serve best as secondary confirmation tools, not standalone trade triggers.
- Long-term success requires combining chart analysis with systematic risk management to navigate false breakouts and changing market regimes.
Core Foundations of Technical Analysis
At its core, technical analysis comes down to studying the footprint of market psychology. Every tick on a price chart represents a real execution between a buyer and a seller. When thousands of institutional and retail participants interact simultaneously, their collective emotions—primarily fear, greed, conviction, and hesitation—manifest as visible geometric patterns on price charts.
Technical analysis operates on three foundational assumptions originally derived from Dow Theory:
- Price Discounts Everything: All known fundamental information—economic reports, interest rate decisions, corporate earnings, and global news—is instantly reflected in the current market price.
- Price Moves in Trends: Markets do not move randomly over extended periods. Price tends to travel along directional pathways (uptrends, downtrends, or sideways ranges) until market supply and demand forces rebalance.
- History Repeats Itself: Human psychology remains relatively constant across generations. Chart patterns that reflected market panic or aggressive accumulation fifty years ago continue to appear today because modern traders react to financial risk in predictable ways.
When you practice technical trading, you are not attempting to foresee the future with absolute certainty. Instead, you are building a framework to calculate probabilities. A high-quality chart setup simply indicates that, based on historical market behavior, price is more likely to move in one direction than another.
Framing technical setups around statistical probability allows you to set precise stop-loss levels, size your positions appropriately, and preserve your capital when market conditions shift.
Fundamental Building Blocks: Price Action and Chart Structure
To build a reliable technical analysis framework, you must start with clean charts before introducing complex overlays or indicators. Understanding how raw price moves across different timeframes provides the structural baseline for every trade decision.

Candlestick Charting Mechanics
Candlestick charts are the standard visual tool for modern chart reading. Unlike simple line charts that only display closing prices, a single candlestick reveals four distinct data points over a given period: the open, high, low, and close (OHLC).
The space between the open and close price forms the candlestick's "real body," while the thin lines extending above and below represent the price extremes (wicks or shadows). Learning how to read candlestick charts allows you to instantly gauge market conviction.
A large green candle with minimal wicks shows aggressive buying control, whereas a long upper wick above a small candle body indicates that sellers forcefully pushed price back down before the session closed.
Raw Price Behavior
Before relying on lagging mathematical formulas, analyzing raw price charts provides immediate visibility into order flow. Learning price action gives you the ability to identify market structure simply by observing swing highs and swing lows.
When buyers consistently step in at higher prices, the market forms a sequence of higher highs and higher lows. Conversely, when sellers push prices progressively lower, the market creates lower highs and lower lows. Evaluating naked price charts prevents "paralysis by analysis" and ensures your primary perspective stays anchored to actual market behavior.
Support and Resistance Zones
Prices rarely move in straight lines. As price travels, it encounters structural barriers where buying or selling interest suddenly concentrates. Understanding support and resistance helps you identify these critical inflection points:
- Support: A price level below the current market where buying demand is historically strong enough to prevent price from falling further.
- Resistance: A price level above the current market where selling pressure routinely overwhelms buying momentum, causing price to pause or reverse downward.
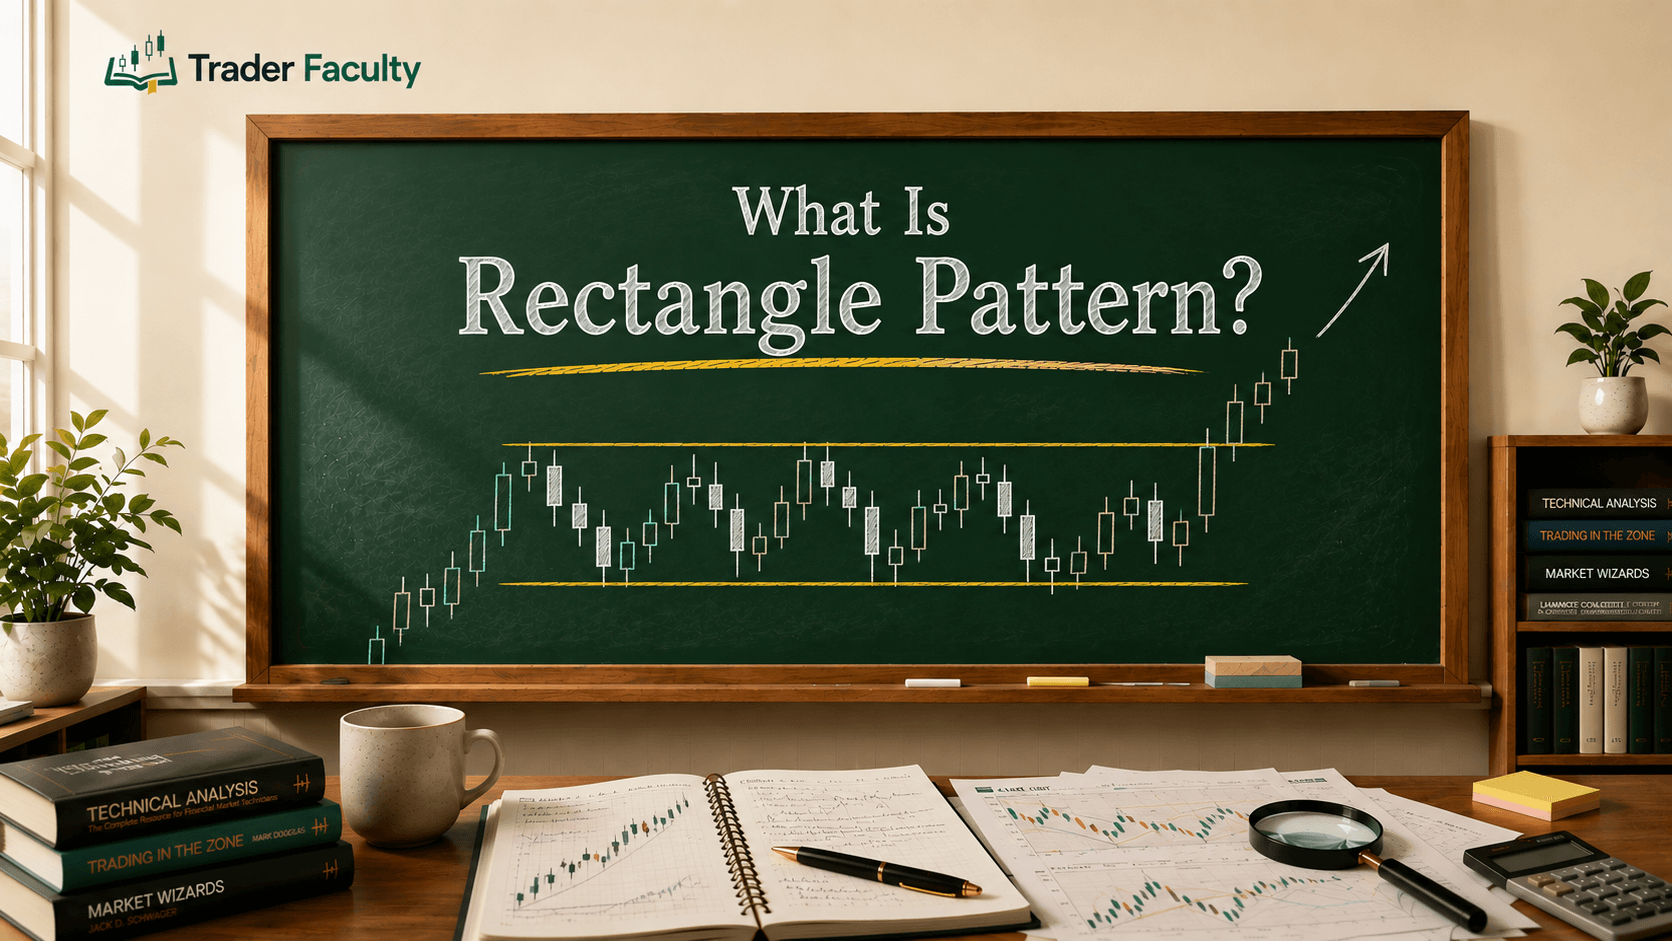
Rather than treating these levels as razor-thin lines, experienced traders treat them as dynamic supply and demand zones. Mastering support and resistance levels involves charting key historical turning points, identifying high-volume consolidation areas, and noting round psychological numbers across multiple timeframes.
Trend Dynamics and Lines
Identifying market direction is essential for aligning your trades with the prevailing market momentum. A trend line is a simple visual line drawn across significant swing points on a price chart.
Knowing the trendline and how to draw it correctly prevents you from forcing lines onto ambiguous price data. In an uptrend, a trend line connects two or more consecutive higher lows, serving as dynamic support. In a downtrend, it connects lower highs, acting as dynamic resistance. A valid trend line requires at least two confirmed contact points, with a third touch providing stronger validation of the trend's strength.
Technical Indicators and Oscillators
Once you understand basic chart structure and price action, technical indicators can serve as valuable supplementary tools. Indicators take raw price or volume data and apply mathematical formulas to filter out noise, gauge momentum, or highlight potential volatility expansions.
Trend-Following Indicators
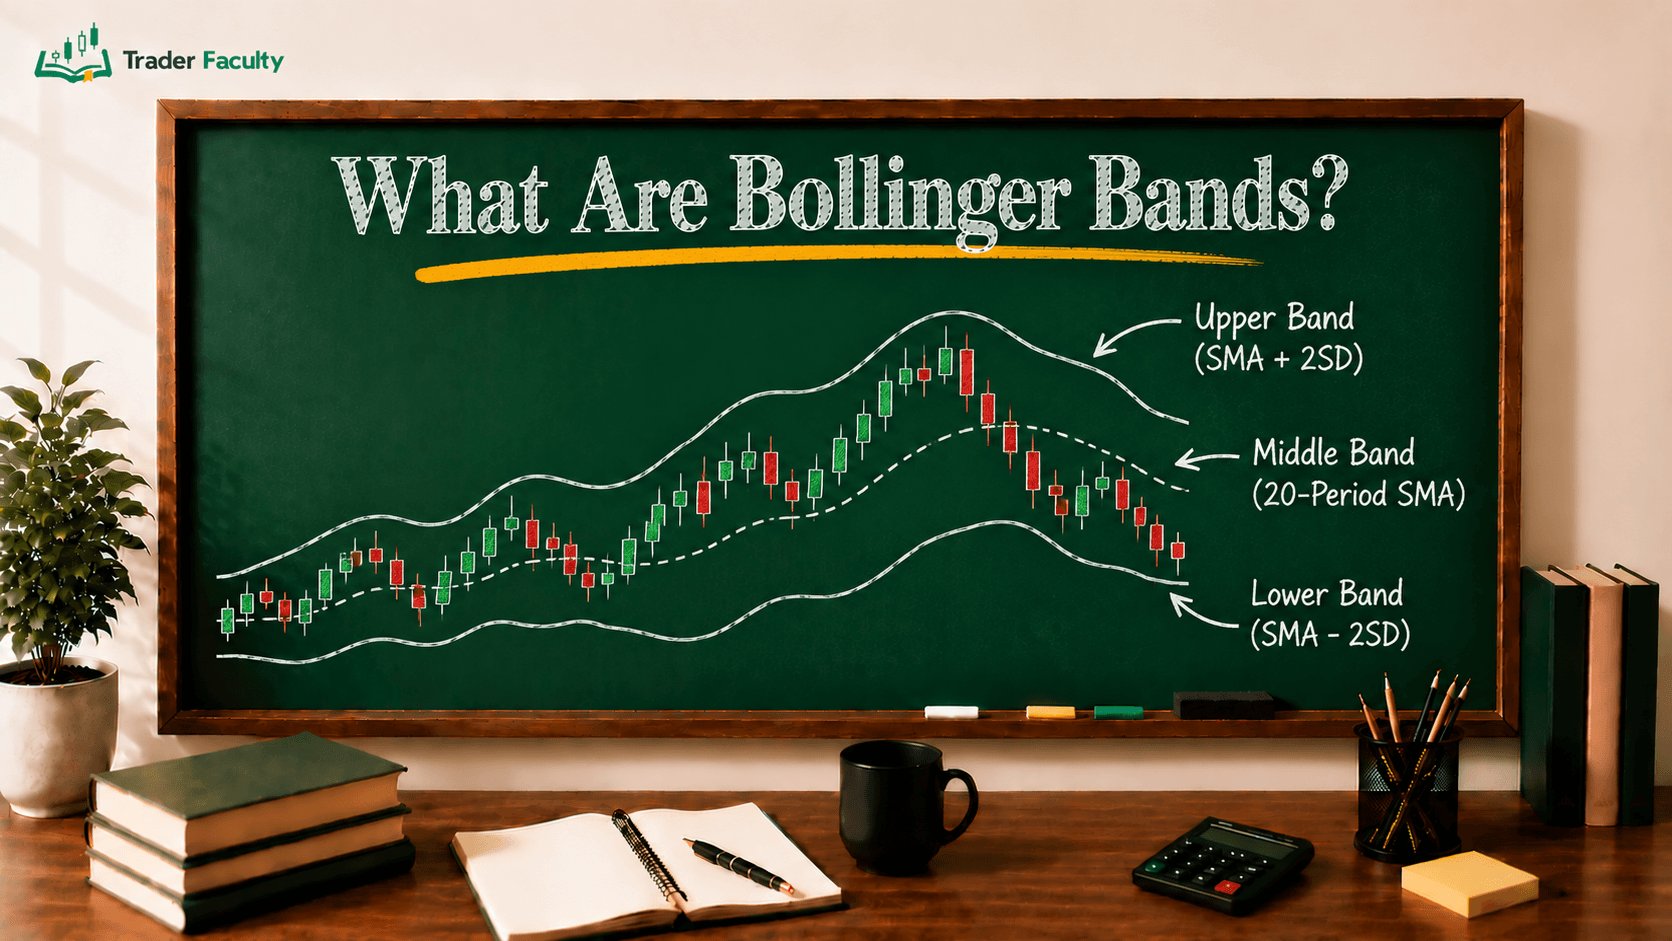
Trend indicators help smooth out choppy price fluctuations to clarify the market's overarching direction. The most widely utilized trend tool is the moving average, which calculates the average price of an asset over a specific number of trading periods.
Understanding moving average formulas allows you to choose the right setting for your specific strategy:
- Simple Moving Average (SMA): Calculates an unweighted average of price over the selected lookback window (e.g., 50 or 200 days).
- Exponential Moving Average (EMA): Places greater weight on recent price data, making it more responsive to short-term price movements (e.g., 9 or 20 periods).
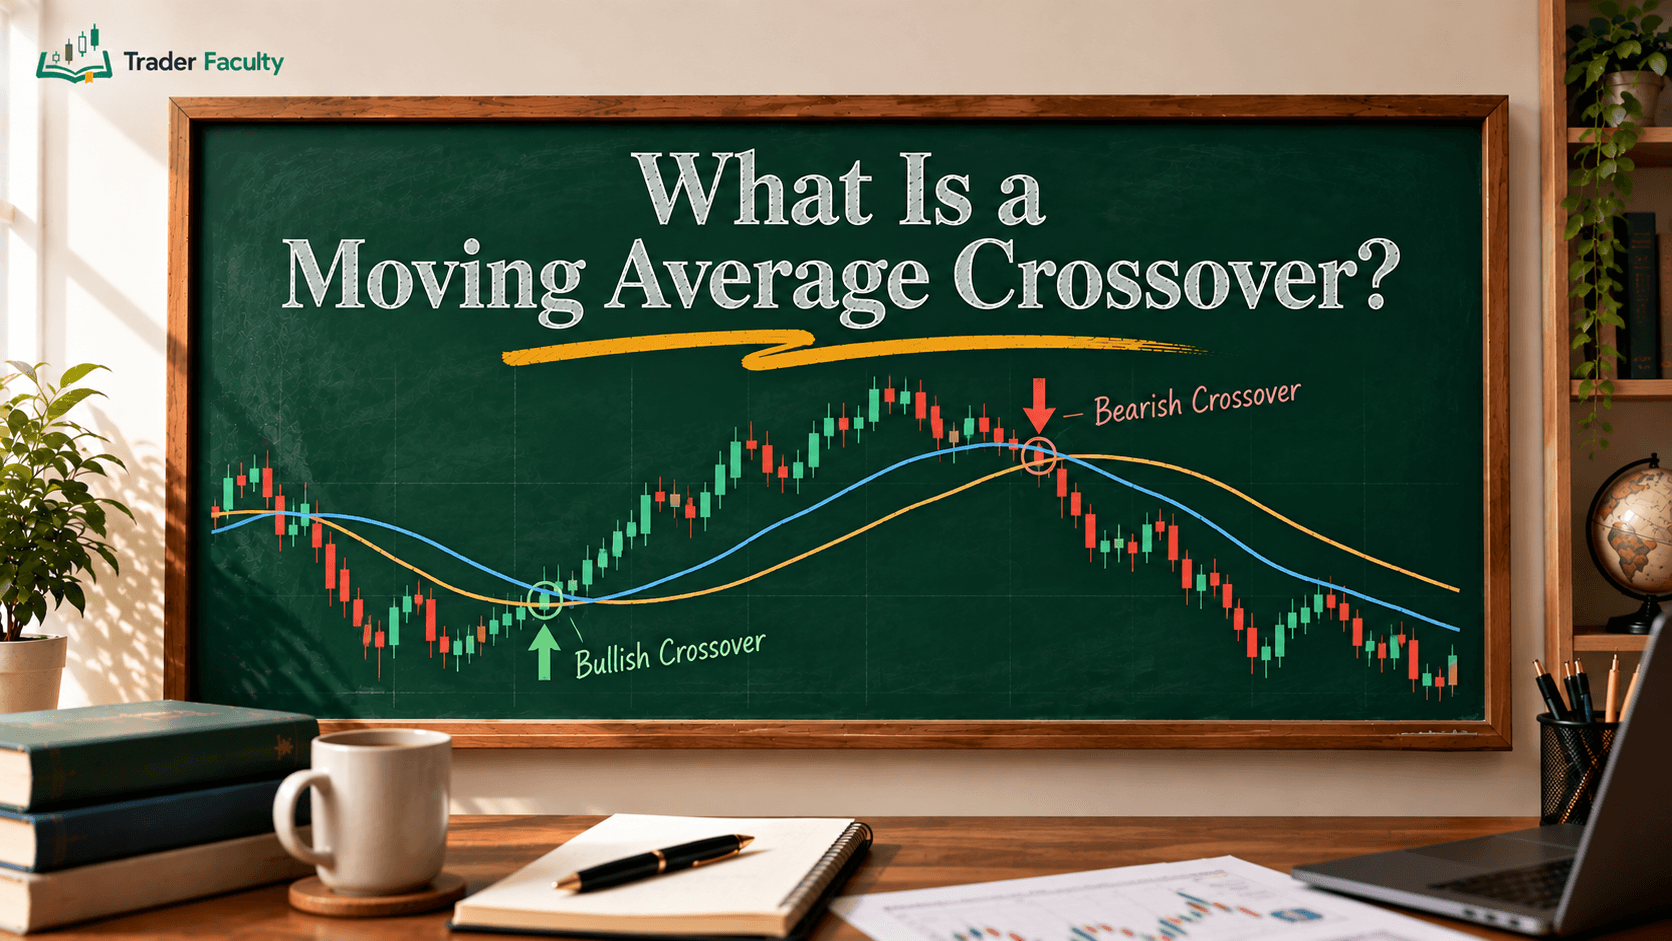
Moving averages can act as dynamic support or resistance zones and help confirm trend direction when shorter-term averages cross above or below longer-term averages.
Momentum Oscillators
Oscillators measure the speed and magnitude of price movements, moving back and forth within a bounded numerical scale. They are particularly useful for detecting market momentum loss or identifying temporary overextended conditions.
Knowing RSI (Relative Strength Index) gives you insight into buying and selling momentum on a 0-to-100 scale. Traditionally, chartists following widely used technical analysis conventions treat an RSI reading above 70 as short-term overbought and a reading below 30 as oversold, though these thresholds are general guidelines rather than fixed rules.
However, in strong trending markets, momentum can remain overbought or oversold for extended periods, meaning oscillator signals should always be confirmed by price action.
Hybrid Indicators
Some tools combine aspects of both trend tracking and momentum measurement. Knowing MACD (Moving Average Convergence Divergence) allows you to analyze market momentum by tracking the distance between two exponential moving averages. The MACD histogram visually illustrates whether buying or selling momentum is accelerating or fading, offering early clues about potential trend reversals or continuations.
| Indicator Category | Common Examples | Primary Function | Ideal Market Condition |
|---|---|---|---|
| Trend-Following | Moving Averages (SMA/EMA) | Filters noise and identifies direction | Strong trending markets |
| Momentum Oscillator | Relative Strength Index (RSI) | Measures speed and rate of change | Ranging / consolidating markets |
| Hybrid / Volume | MACD, On-Balance Volume (OBV) | Tracks momentum shifts & volume confirmation | Trend transitions & breakouts |
Technical Analysis vs. Fundamental Analysis
To build a well-rounded trading perspective, you must understand how technical analysis compares to market fundamentals. While both approaches aim to identify profitable trading opportunities, they analyze financial markets through fundamentally different lenses.
Comparative Framework
Fundamental analysis focuses on evaluating an asset's intrinsic value. When studying equities, fundamental analysts examine corporate income statements, balance sheets, management quality, and industry growth. In commodities or forex, they analyze economic growth data, inflation metrics, interest rate trends, and central bank policies.
By contrast, technical analysis focuses entirely on price history, chart patterns, and trading volume. A technical trader assumes that all fundamental factors are already priced into the market and that price structure dictates trade timing.
Understanding fundamental analysis alongside chart reading highlights their distinct roles:
- Fundamental Analysis: Answers what asset to trade based on valuation, economic health, or underlying growth potential.
- Technical Analysis: Answers when and at what exact price to enter, place a stop-loss, and exit based on chart structure and risk-to-reward ratios.
Synthesizing Both Approaches
Rather than treating technical and fundamental analysis as opposing philosophies, many institutional and retail traders combine both disciplines. For example, a trader might use fundamental analysis to establish a long-term bullish bias on a currency pair due to widening interest rate differentials, then turn to price action charts to locate high-probability pullback entries at key support levels.
Does Technical Analysis Work in Modern Markets?
A common question among developing traders is whether chart reading remains effective in an era dominated by high-frequency trading algorithms, automated execution, and massive institutional capital flow.
Evaluating technical analysis work requires a realistic understanding of what technical tools can and cannot achieve. Technical analysis is not a predictive crystal ball or a guaranteed profit generator. It is a systematic method for organizing market data and quantifying risk.

Technical analysis provides a statistical edge because millions of market participants—including algorithmic trading systems—monitor the exact same historical price boundaries. When a major asset approaches a widely followed daily support zone or 200-day moving average, order flow naturally concentrates around that level. This clustering of buy and sell orders creates self-fulfilling structural reactions that traders can exploit systematically.
However, technical analysis has clear limitations:
- False Breakouts: Price frequently breaches technical support or resistance levels temporarily to capture liquidity before reversing back inside the range.
- Fundamental News Shocks: Unexpected economic data releases, central bank policy shifts, or geopolitical events can instantly invalidate technical chart setups.
- Slippage and Liquidity Gaps: In fast-moving or low-liquidity markets, orders may execute at prices significantly worse than anticipated, altering calculated risk-to-reward metrics.
The Technical Analysis Learning Roadmap
Navigating chart reading successfully requires a structured, step-by-step learning framework. Attempting to master dozens of indicators simultaneously usually leads to confusion and inconsistent execution.
Here is the structured path designed for technical analysis for beginners:
- Master Candlesticks & Market Structure: Focus on understanding individual candle mechanics, swing highs, swing lows, and trend identification across daily and lower timeframes.
- Map Support, Resistance & Trend Lines: Practice drawing clean horizontal support/resistance zones and trend lines on historical charts to identify market structure boundaries.
- Incorporate Select Indicators: Select one trend-following indicator (like an EMA) and one momentum tool (like RSI) to confirm setups rather than cluttering your screen with conflicting overlays.
- Develop a Rule-Based System: Define explicit rules for trade entry, stop-loss placement, profit targets, and position sizing based on strict risk management parameters.
- Backtest and Keep a Journal: Test your methodology against historical data and log every live execution to objectively measure your win rate and risk-to-reward ratio over time.
Where to Start Your Technical Trading Journey
Starting your technical analysis journey begins with setting up clean, functional charts on a reputable platform such as TradingView. Avoid loading default templates filled with multiple indicators. Start with a plain candlestick chart set to a high timeframe (such as the daily or 4-hour chart) for major liquid assets.
Spend time observing how price behaves as it approaches historical high and low points. Practice identifying market trends, drawing clean support and resistance zones, and observing how price candles react when approaching those levels.
As your comfort with chart structure grows, you can begin exploring advanced concepts such as multi-timeframe alignment, chart pattern execution, and detailed risk-reward structuring.
Conclusion
Technical analysis provides an objective, structured framework for interpreting market price action, identifying trend direction, and establishing precise entry and exit parameters. By mastering candlestick mechanics, price structure, horizontal support and resistance, and key technical indicators, you can evaluate financial markets through statistical probability rather than emotion or guesswork.
Always remember that technical chart reading is only one piece of the puzzle—combining sound technical analysis with strict risk management and discipline is what builds a sustainable trading approach over time.
Frequently Asked Questions
What is technical analysis in simple terms?
Technical analysis is the practice of reading price charts to identify market trends and trading opportunities. Instead of evaluating financial statements or economic news, technical analysis focuses on price history, chart patterns, and volume to help traders decide when to enter and exit trades.
Does technical analysis actually work?
Technical analysis works as a probabilistic tool for identifying market structure and managing risk, not as a guaranteed prediction method. Because thousands of market participants and algorithms monitor identical support, resistance, and indicator levels, price often reacts predictably at these key technical zones.
What is the difference between technical analysis and fundamental analysis?
Fundamental analysis measures an asset's intrinsic value by examining economic data, corporate financial statements, and interest rate policies to decide what to trade. Technical analysis studies historical price action and chart patterns to determine the optimal timing, entry levels, and stop-loss placements for a trade.
What are the four main technical analysis tools?
The four primary technical analysis tools are candlestick charts for price action, horizontal support and resistance levels for supply and demand zones, trendlines for direction, and technical indicators like moving averages or RSI for momentum confirmation.
How do beginners start learning technical analysis?
Beginners should start with clean price action charts rather than loading multiple indicators. Master basic candlestick mechanics first, learn to map support and resistance levels, practice identifying market trends, and then introduce secondary indicators like moving averages to confirm trade setups.
The Trader Faculty Team writes and reviews every guide together — pairing hands-on market experience with a curriculum-first approach to trading education. One good syllabus, taught in the order that makes you better.