What Is Calmar Ratio? Downside Risk in Trading Explained
Learn how the Calmar Ratio evaluates annualized returns against maximum drawdown risk. Read the full guide.
By Trader Faculty Team
Direct Answer
The Calmar Ratio is a risk-adjusted performance metric that compares a trading strategy's annualized return to its maximum drawdown (its largest peak-to-trough loss) over a set period, traditionally 36 months. By dividing compound annual return by that worst drop, it focuses on downside risk rather than total price volatility.
When you evaluate a trading strategy, raw returns only tell half the story. A strategy generating a 30% annual return might look attractive on paper. But if it suffered a 50% account drawdown (a drop from its peak) along the way, many traders would find that swing hard to stomach.
To judge performance fairly, active traders rely on risk-adjusted metrics (measures of return compared with the risk taken).
This guide breaks down the Calmar Ratio, a risk-adjusted metric that compares annualized return with maximum drawdown risk. You'll learn how to calculate it and how to use it when backtesting trading strategies.
Quick Takeaways
- The Calmar Ratio measures annualized compound return relative to maximum peak-to-trough drawdown over a specified timeframe.
- Unlike the Sharpe Ratio, which penalizes all volatility, this metric focuses only on the largest downside drop.
- The traditional lookback period (the window of past data used) is 36 months (3 years).
- A higher ratio points to stronger historical return per unit of drawdown risk, though past results don't predict future ones.
What Is the Calmar Ratio?
The Calmar Ratio is a risk-adjusted performance metric that evaluates a trading strategy or fund by comparing its annualized compound return to its worst historical peak-to-trough drop. Introduced by fund manager Terry W. Young in 1991, according to commonly cited accounts, the name "Calmar" is an acronym for California Managed Accounts Reports.
In trading, performance metrics usually fall into two categories: total volatility measures and drawdown measures. While metrics like standard deviation (how widely returns swing) treat both upside price surges and downside crashes as equal "risk," this metric isolates large account declines. It answers a fundamental question for traders: How much annual return did this strategy generate for every percentage point of peak-to-trough loss suffered?
Because it focuses on large account drawdowns, quantitative traders (who build rules-based models) and hedge fund managers often use it to evaluate systematic trading models, CTA (commodity trading advisor) managed futures programs, and automated strategies.
How the Calmar Ratio Is Calculated
Calculating it requires two key metrics over a defined historical period: annualized return and maximum drawdown.
Calmar Ratio = Annualized Return / Maximum Drawdown
Where:
- Annualized Return: The Compound Annual Growth Rate (CAGR) achieved by the trading strategy over the specified period.
- Maximum Drawdown: The largest percentage decline from an equity peak to a subsequent trough before a new peak is reached.
Step-by-Step Calculation Example
Suppose you backtest an automated trend-following system over a 3-year period:
- Initial Equity: $10,000 grows to $15,208 over 3 years, resulting in an Annualized Return of 15%.
- Equity Curve Analysis: During the test, the account peaked at $14,000 before dropping to $12,600 during a market consolidation phase (a sideways period), before making new highs.
- Maximum Drawdown Calculation: Maximum Drawdown = ($14,000 - $12,600) / ($14,000) = ($1,400) / ($14,000) = 10%
Applying the formula:
Calmar Ratio = (15%) / (10%) = 1.5
In this scenario, the strategy produced 1.5 units of annualized return for every 1 unit of maximum drawdown risk taken. These figures are for illustration only.
The 36-Month Standard Lookback Window
By industry convention, the Calmar Ratio is traditionally calculated using a 36-month (3-year) rolling window. Three years is generally considered long enough to expose a strategy to different market regimes (market conditions)—such as bull trends, bear markets, and sideways consolidations—without letting outdated historical data obscure recent performance.
Calmar Ratio vs. Sharpe Ratio vs. Sortino Ratio
Traders often compare it with other risk-adjusted performance metrics, such as the Sharpe ratio and the Sortino ratio. While all three aim to measure return relative to risk, they define "risk" differently.
| Performance Metric | Primary Focus | Definition of Risk | Best Used For |
|---|---|---|---|
| Sharpe Ratio | Total Volatility | Standard deviation of total returns (upside + downside variance) | Broad asset allocation & traditional fund evaluation |
| Sortino Ratio | Downside Volatility | Downside deviation (only negative returns relative to a threshold) | Strategies whose upside swings are larger than their downside swings |
| Calmar Ratio | Maximum Tail Risk | Peak-to-trough Maximum Drawdown | Studying drawdown risk in systematic trading strategies |
- Sharpe Ratio penalizes price swings regardless of direction. A sudden upside breakout increases standard deviation, which lowers the Sharpe Ratio despite helping account equity.
- Sortino Ratio improves upon Sharpe by ignoring upside volatility and penalizing only negative returns below a target threshold.
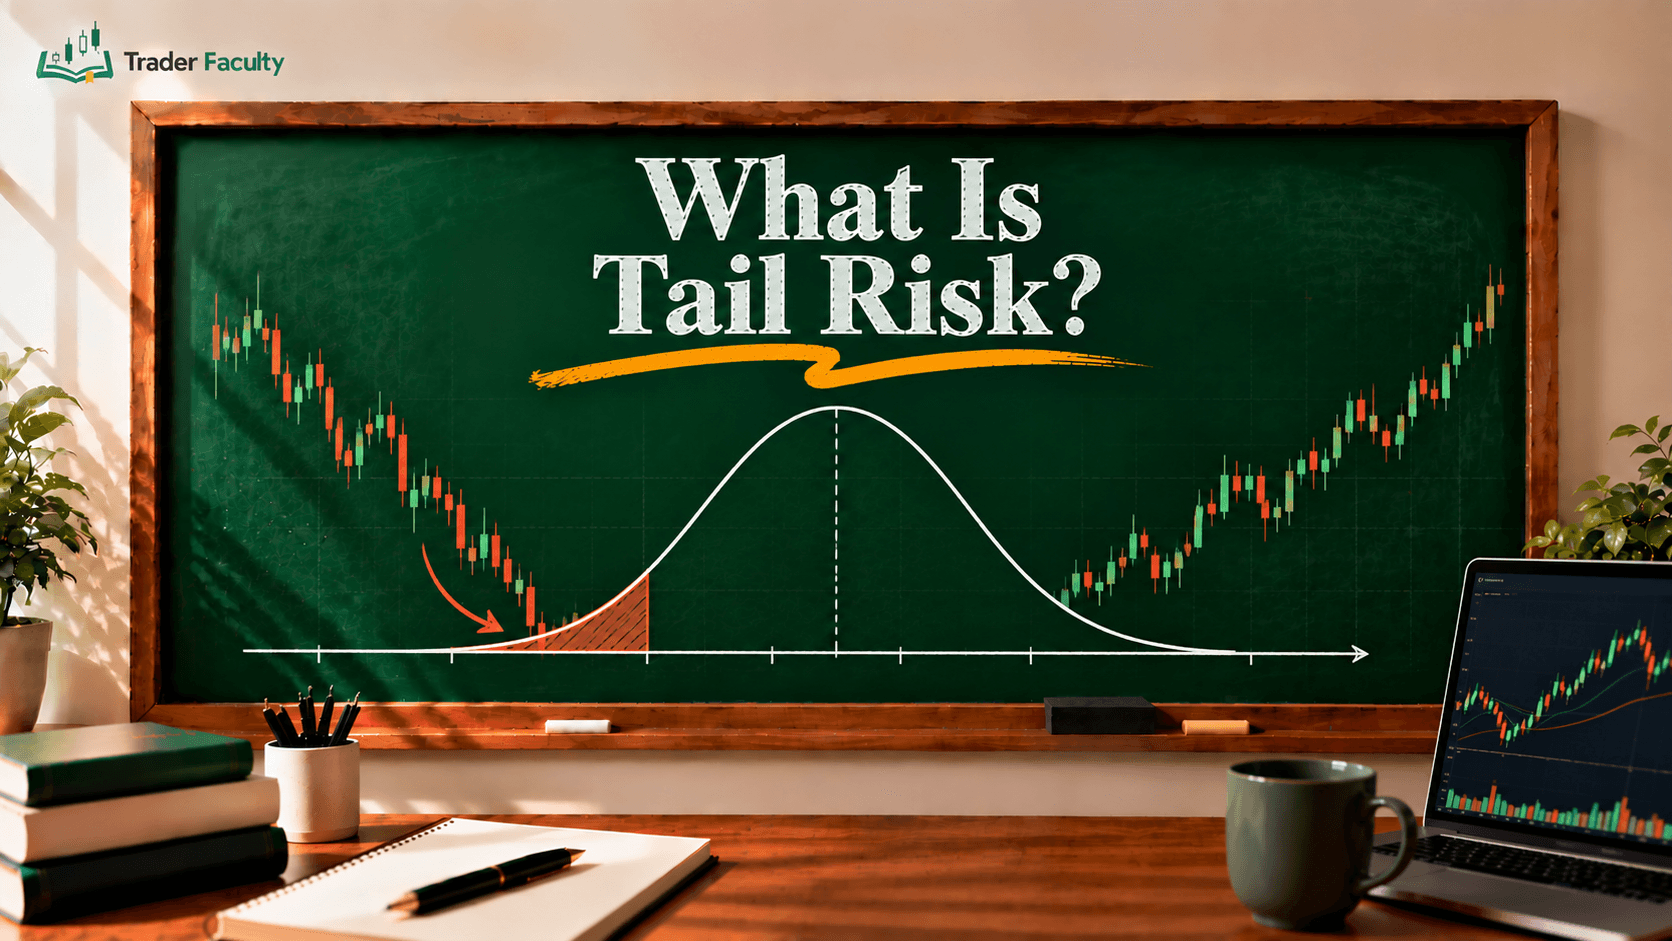
- Calmar ignores daily variance entirely and focuses solely on the maximum equity drop. It highlights tail risk and worst-case drawdown scenarios.
How Traders Use It in Strategy Backtesting
In algorithmic trading (trading by computer rules) and systematic quantitative analysis, backtests (tests of rules on past data) can easily produce attractive return curves that mask underlying structural risks. Traders use this metric during backtesting in several ways:
- Filtering Over-Optimized Strategies (tuned too closely to past data): A strategy showing a 40% annual return might seem better than one returning 20%. But if the first had a 40% maximum drawdown (ratio = 1.0) while the second had a 5% maximum drawdown (ratio = 4.0), the second delivers far more return per unit of drawdown risk.
- Benchmarking Strategy Thresholds: Acceptable ratios vary by asset class and holding period. As a rough rule of thumb, not an official benchmark, some traders look for a ratio above 1.0 over a 36-month backtest, with readings above 2.0 seen as stronger. Past results don't guarantee future performance.
- Evaluating Tail-Risk Survival: Market shocks like a black swan event (a rare, unexpected shock) can trigger rapid equity declines. Evaluating maximum drawdown helps a trader understand the worst historical account decline before committing real capital.
Limitations and Common Pitfalls
While this metric is a useful tool for downside risk evaluation, relying on it in isolation introduces several potential traps:
- Sensitivity to Timeframes: Because the denominator depends on a single data point (the largest peak-to-trough decline), changing the start or end date of a backtest by a few months can change the ratio a lot. If a large drawdown falls just outside the 36-month window, the ratio can look artificially strong.
- Ignoring Drawdown Recovery Period: The Calmar Ratio measures how deep a drawdown went, but not how long the account remained below its previous peak. A strategy that spends two years recovering from a drawdown carries an opportunity cost that the ratio doesn't capture.
- Outlier Sample Size Risk: Maximum drawdown is a single outlier event. Unlike standard deviation or downside deviation, which aggregate hundreds of daily returns, it's based on one historical episode.
- False Security in Bull Markets: A short backtest run entirely during a strong market rally can show an artificially low drawdown, which inflates the ratio and may not hold up when market conditions change.
Conclusion
The Calmar Ratio gives systematic traders a clear, targeted way to assess downside exposure by measuring annualized return against maximum peak-to-trough drawdown. By focusing on tail risk (rare, large losses) rather than general volatility, it adds useful context when you build backtests or select trading algorithms. Like any backtest metric, it reflects the past and can't predict future results.
To build a durable trading approach, combine downside risk metrics like this one with position sizing rules and structured risk controls. Explore our risk management guides to learn ways to manage risk across changing market conditions.
Frequently Asked Questions
What is a good Calmar Ratio for a trading strategy?
There's no official standard. Some traders treat a ratio above 1.0 as acceptable and 2.0 or higher as strong, but this is only a rough rule of thumb. What counts as good depends on the asset class, holding period, and market volatility, and past results don't guarantee future ones.
How does the Sharpe Ratio differ from this metric?
The Sharpe Ratio measures return relative to total volatility (standard deviation), penalizing upside spikes and downside drops equally. This metric measures return against maximum drawdown only, so it focuses on the largest peak-to-trough account decline.
Why is a 36-month lookback period traditional?
A 36-month (3-year) period is long enough to expose a strategy to multiple market regimes (such as bull trends, bear markets, and consolidations). It also avoids letting outdated data distort recent performance, though it's a convention rather than a rule.
Can a high Calmar Ratio be misleading?
Yes. A high reading can be misleading if it's calculated during a prolonged bull market where drawdowns were unusually low, or if the 36-month window happens to leave out a major market crash.
What is the difference between Calmar and the MAR ratio?
Calmar traditionally uses a rolling 36-month window to measure annualized return relative to maximum drawdown. The MAR ratio uses the same calculation but looks at the entire life of the fund or strategy since inception.
Keep learning
Risk & Money Management
One good article won't save your account. A risk framework will.
7 lessons quiz
Start the courseThe Trader Faculty Team writes and reviews every guide together — pairing hands-on market experience with a curriculum-first approach to trading education. One good syllabus, taught in the order that makes you better.