What Is Gross Margin? How It Works and How to Calculate It
Learn what gross margin is, how to calculate it, and why traders use it to spot pricing power. Read the full guide.
By Trader Faculty Team
Direct Answer
Gross margin measures the proportion of total revenue remaining after subtracting direct production costs like raw materials and factory labor. It reflects core manufacturing or service efficiency before accounting for operating overhead, interest, and taxes. Fundamental traders analyze gross margin trends to evaluate corporate pricing power and economic moats.
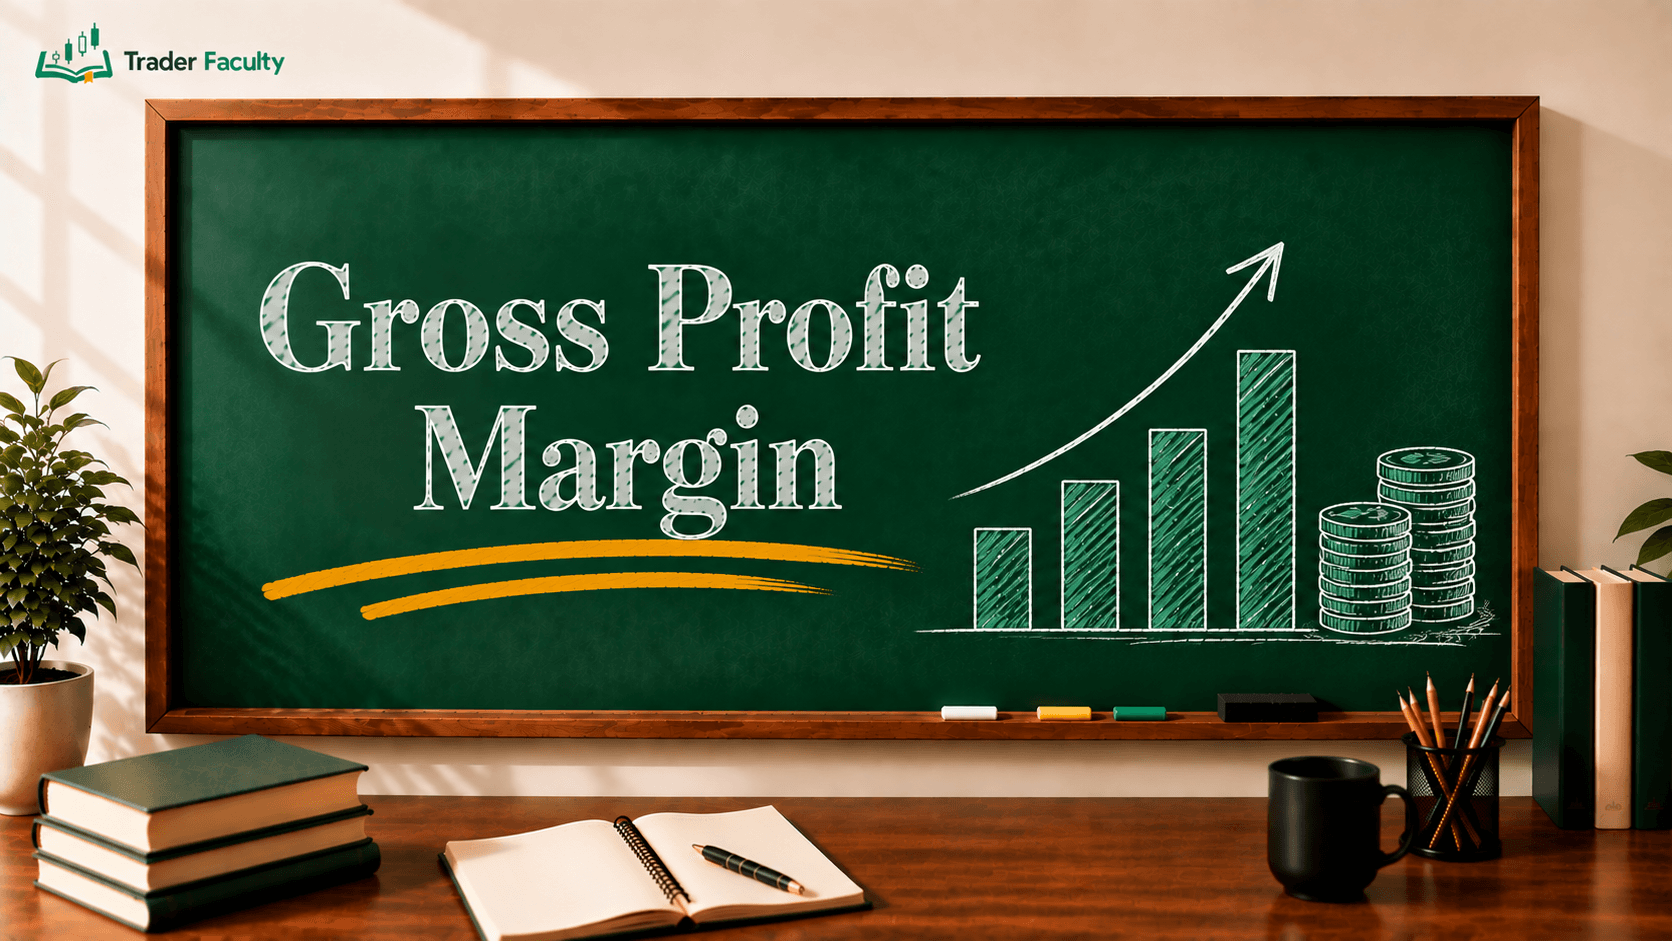
Gross margin is the percentage of sales revenue a company keeps after paying the direct costs of producing its goods or services. It shows how efficiently a business converts direct labor and raw materials into profit before paying overhead expenses.
When evaluating stocks, many traders focus only on top-line revenue growth and miss underlying operational problems. A business can double its sales, but if production costs rise faster than income, total profitability suffers. Once you understand this metric, you'll be able to evaluate a company's pricing power, compare corporate health against industry peers, and spot competitive advantages early.
Quick Takeaways
- Gross margin measures direct production efficiency by showing the percentage of revenue remaining after subtracting direct production costs.
- High gross margins give companies extra cash to absorb inflation, reinvest in research, and stay profitable during economic downturns.
- Sector benchmarks vary significantly, meaning software firms naturally report far higher margins than retail grocery chains.
- Consistent margin expansion often signals strong pricing power and a widening competitive advantage before net profits reflect it.
What Is Gross Margin? (Definition & Meaning)
What is gross margin in corporate accounting? At its core, gross margin meaning refers to the ratio of gross profit relative to total revenue. It reveals how much money a company retains from every dollar of sales to cover fixed overhead, debt payments, and shareholder returns.
To understand this metric, traders must split corporate expenses into two primary categories:
- Cost of Goods Sold (COGS): Direct expenses required to manufacture a product or deliver a service. This includes raw materials, direct factory labor, assembly line equipment depreciation, and shipping expenses to get products to sellers.
- Operating Expenses (OpEx): Indirect expenses needed to run the daily business. This includes executive salaries, marketing campaigns, office rent, software licenses, and legal fees.
This ratio focuses strictly on COGS. By isolating direct production costs from administrative overhead, traders can see whether a company's core product is profitable on its own merits.
The Gross Margin Formula and Calculation
Calculating this metric requires two numbers from a company's income statement: total revenue and COGS. The gross margin formula expresses this relationship as a percentage:
Gross Margin (%) = ((Revenue - Cost of Goods Sold) / Revenue) x 100
Alternatively, because Revenue minus COGS equals Gross Profit, you can express the gross margin ratio as:
Gross Margin Ratio = Gross Profit / Revenue
Calculation Example: Manufacturing vs. Software
To see how this formula works in practice, consider two hypothetical companies with $10,000,000 in annual revenue:
- Company A (Industrial Manufacturer):
- Total Revenue: $10,000,000
- Cost of Goods Sold (steel, factory labor, freight): $6,500,000
- Gross Profit = $10,000,000 - $6,500,000 = $3,500,000
- Gross Margin = ($3,500,000 / $10,000,000) x 100 = 35%
- Company B (Cloud Software Provider):
- Total Revenue: $10,000,000
- Cost of Goods Sold (server hosting, customer support): $1,500,000
- Gross Profit = $10,000,000 - $1,500,000 = $8,500,000
- Gross Margin = ($8,500,000 / $10,000,000) x 100 = 85%
Company B keeps 85 cents of every sales dollar to fund research and marketing, while Company A keeps only 35 cents.
Gross Margin vs. Gross Profit: Key Differences

Beginner traders often confuse these two terms because both measure initial profitability. However, they serve different analytical roles.
Gross profit is an absolute monetary amount measured in dollars (or local currency). Gross margin, by contrast, is a relative ratio expressed as a percentage.
Comparing absolute gross profit between two companies can be misleading if one firm is much larger than the other. Evaluating percentage margins levels the playing field.
| Metric | Definition | Measurement Unit | Primary Use for Equity Traders |
|---|---|---|---|
| Gross Profit | Total revenue remaining after subtracting direct production costs | Monetary value ($) | Measures absolute scale of initial production earnings |
| Gross Margin | Percentage of sales revenue retained after paying direct production costs | Percentage (%) | Evaluates operational efficiency and pricing power across competitors |
While calculating raw profit shows total earnings scale, analyzing the broader gross profit margin metric allows traders to evaluate operating efficiency regardless of company size.
Why Gross Margin Matters for Fundamental Equity Traders
Stock prices ultimately follow corporate earnings quality over long time horizons. Tracking direct margin trends gives fundamental traders three distinct insights into a company's competitive standing.
1. Pricing Power and Inflation Defense
When raw material prices rise or supply chains face disruption, companies with high margins can absorb higher costs without going unprofitable. Alternatively, firms with strong brand loyalty can raise retail prices to protect their profit margins without losing customers.
2. Identifying Economic Moats
A stable or growing margin over five to ten years indicates a strong economic moat—a lasting competitive advantage. This advantage might stem from proprietary technology, lower manufacturing costs from massive scale, or brand recognition that commands premium pricing.
Financial analysis standards published by the CFA Institute emphasize evaluating profitability measures relative to sales to determine whether competitive advantages are expanding or shrinking over time.
3. Early Warning Signal (Expansion vs. Compression)
Changes in direct production efficiency often appear before net income shifts on quarterly earnings reports.
- Margin Expansion: When it increases over several consecutive quarters, the company is lowering its production costs per unit or selling products at higher prices. This trend often leads to positive earnings surprises.
- Margin Compression: When it shrinks, production costs are climbing faster than sales prices. Even if total revenue grows, narrowing margins warn that future earnings per share may fall short of market expectations.
Sector Benchmarks: High vs. Low Gross Margin Industries
There is no universal target for what constitutes a "good" margin. Acceptable range varies drastically depending on an industry's capital requirements and business structure.
The ranges below reflect typical industry margins as of recent fiscal years and can shift with macroeconomic conditions.
| Industry Sector | Typical Gross Margin Range | Primary Cost Drivers in COGS | Industry Operational Characteristics |
|---|---|---|---|
| Software / SaaS | 70% – 90% | Cloud hosting, customer onboarding, payment fees | Low cost to replicate code; high upfront development costs fall into OpEx |
| Pharmaceuticals | 65% – 80% | Chemical synthesis, packaging, sterile production | Low production cost per pill; massive research expenses fall into OpEx |
| Consumer Electronics | 30% – 50% | Component parts, assembly labor, factory tooling | Moderate capital intensity; strong brand pricing balances high component costs |
| Automotive | 15% – 25% | Metals, batteries, robotics, assembly plant labor | Heavy capital requirements; tight competition limits room for price increases |
| Retail Grocery | 15% – 25% | Food wholesale purchases, spoilage, freight shipping | High volume business model relying on thin margins and fast inventory turn |
Comparing a software firm's 80% margin against a grocery chain's 20% margin is meaningless. Fundamental traders must evaluate a stock against its direct competitors within the same sector.
Common Gross Margin Pitfalls for Beginners
Analyzing financial statements requires looking at the entire picture rather than isolated metrics. Beginners frequently fall into three interpretation traps.
Pitfall 1: Assuming High Gross Margin Guarantees Net Profits
A high margin only proves that direct production is efficient. If a company spends excessively on marketing, executive salaries, or debt interest, operating expenses can wipe out gross profits completely, resulting in net losses.
Pitfall 2: Cross-Industry Comparisons
Judging a low-margin retail business as "weak" compared to a high-margin tech company overlooks business model differences. Retailers make up for low margins by selling huge volumes of goods quickly, generating strong overall cash flow.
Pitfall 3: Accounting Reclassifications
Companies sometimes shift line items between COGS and Operating Expenses. For example, moving customer support expenses out of COGS and into OpEx artificially inflates the ratio without improving actual profitability. Traders should review notes in annual SEC filings to verify consistency.
Conclusion
This metric serves as a diagnostic tool for evaluating product health, pricing power, and production efficiency. High or expanding margins provide a buffer against inflation and give companies room to fund future growth. However, direct production margins are only one piece of the puzzle.
To build a complete view of corporate strength, fundamental traders combine margin analysis with broader profitability indicators, balance sheet evaluations, and operational debt reviews. Understanding how this metric works alongside other core financial ratios equips you to filter out fragile companies and select resilient stocks for your trading portfolio.
Trading equity markets always carries the risk of losing capital, so treat fundamental metrics as research tools rather than direct buy or sell signals.
Frequently Asked Questions
What is a good gross margin percentage?
A good gross margin depends heavily on the industry. Tech and software companies often report margins above 70%, while retail grocers operate on 15% to 25%. Rather than seeking an arbitrary target, compare a company's margin against direct sector peers and track whether it is expanding or shrinking over multi-year periods.
What is the difference between gross margin and gross profit?
Gross profit measures initial earnings in absolute dollar terms by subtracting direct production costs from revenue. Gross margin expresses that same relationship as a percentage of revenue. While gross profit reflects absolute earnings scale, gross margin allows traders to evaluate operating efficiency across companies of different sizes.
Can a company have a high gross margin and still lose money?
Yes. Gross margin only accounts for direct production costs. If a business carries high operating expenses—such as heavy advertising, excessive corporate salaries, or high interest payments on corporate debt—those indirect costs can completely erase gross profit, causing the company to post a net loss on the bottom line.
What causes gross margin compression?
Gross margin compression occurs when direct production costs increase faster than sales prices. Common causes include rising raw material costs, supply chain bottlenecks, wage inflation, or aggressive product discounting to clear excess inventory. Compressing margins often signal weakening pricing power or intensified competition within the industry sector.
Why do gross margins vary so much across different industries?
Gross margins vary because different industries require different production models. Software companies face minimal costs to deliver extra digital units, resulting in high margins. Retailers and manufacturers spend heavily on raw materials, factory equipment, and freight per item sold, leading to lower margins offset by higher total sales volume.
The Trader Faculty Team writes and reviews every guide together — pairing hands-on market experience with a curriculum-first approach to trading education. One good syllabus, taught in the order that makes you better.